A prompt change takes the eval from 80% to 85%. The eval has 40 cases. Someone screenshots it, the change ships, and nobody ever finds out that the same two prompts run again would have swapped places.
Forty cases at 80% means the true pass rate is somewhere between 65% and 90%. That is not a rounding detail, it is most of the range you care about. Evals are experiments, and experiments have sample sizes. This post is the arithmetic for how many cases you need, why the number is bigger than anyone wants, and what to do when you cannot get there.
Why 40 cases cannot see a 5-point win
Every eval score is a sample. You ran 40 questions out of the infinite set of questions your users might ask, and 32 passed. Run a different 40 and you would get a different number.
The right way to show that is a confidence interval. The Wilson score interval is the one to use: the textbook normal approximation, the one you may have learned as p̂ ± 1.96√(p̂(1−p̂)/n), breaks down at small n and near 0% or 100%, where it produces intervals of zero width or intervals that run past 100%. Wikipedia's page on binomial proportion intervals sets out both, and the Wilson interval is well behaved in exactly the places evals live: high pass rates, small samples.
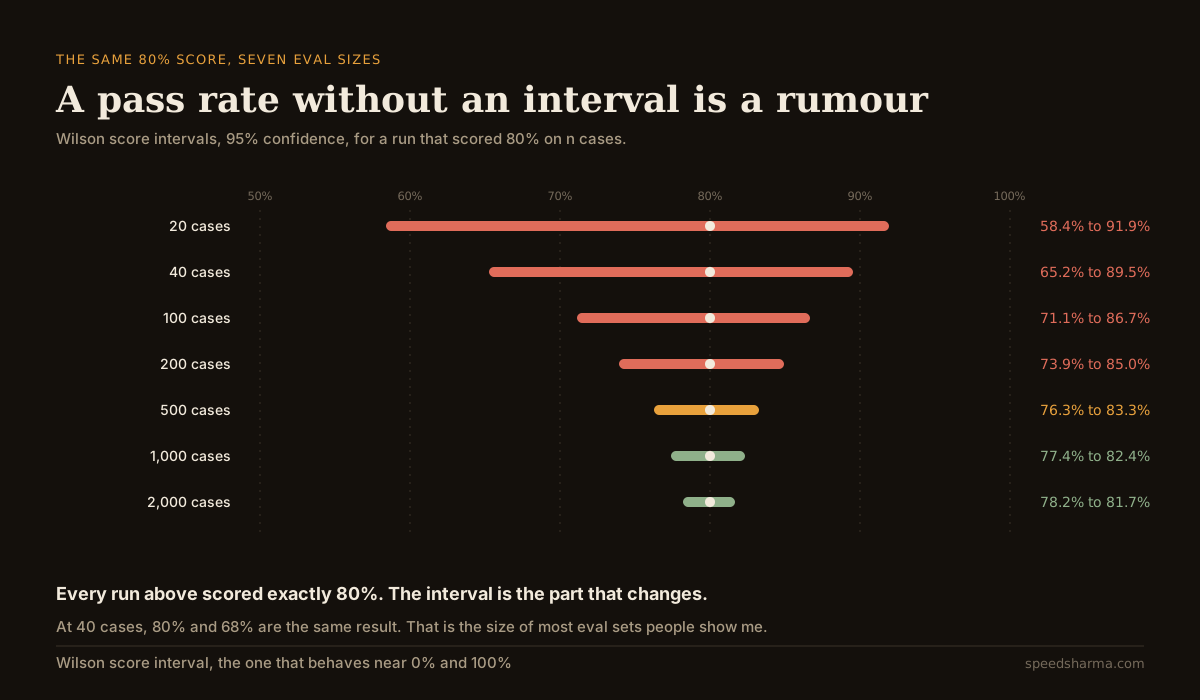
At 20 cases, 80% means "somewhere between 58% and 92%". At 500 it means "between 76% and 83%". Only at the bottom of that chart does the score start behaving like the number people treat it as.
There is a related trap at the top. A run that passes 20 out of 20 has a 95% interval of 83.9% to 100%. A perfect score on a small eval is consistent with a model that fails one in six.
The formula
Comparing two pass rates is a two-proportion z-test, and the sample size for one is standard statistics. Wikipedia's two-proportion z-test page and NIST's engineering handbook both give it in the same shape:
n per variant = ( z(α/2)·√(2·p̄·(1−p̄)) + z(β)·√(p₁(1−p₁) + p₂(1−p₂)) )² / (p₂ − p₁)²

p₁  the baseline pass rate            p₂  the rate you want to be able to detect
p̄   the two averaged                  z   the normal quantiles

95% confidence → z(α/2) = 1.96        80% power → z(β) = 0.84
Four knobs, and only one of them is really yours to choose.
The baseline is whatever you score today. Confidence is how often you are willing to call a difference that is not there; 95% is the convention. Power is how often you will catch a difference that is there; 80% is the convention, and it means you will miss a real improvement one time in five. The difference you want to detect is the only one you get to argue about, and it is the one that moves the answer most, because it is squared in the denominator.
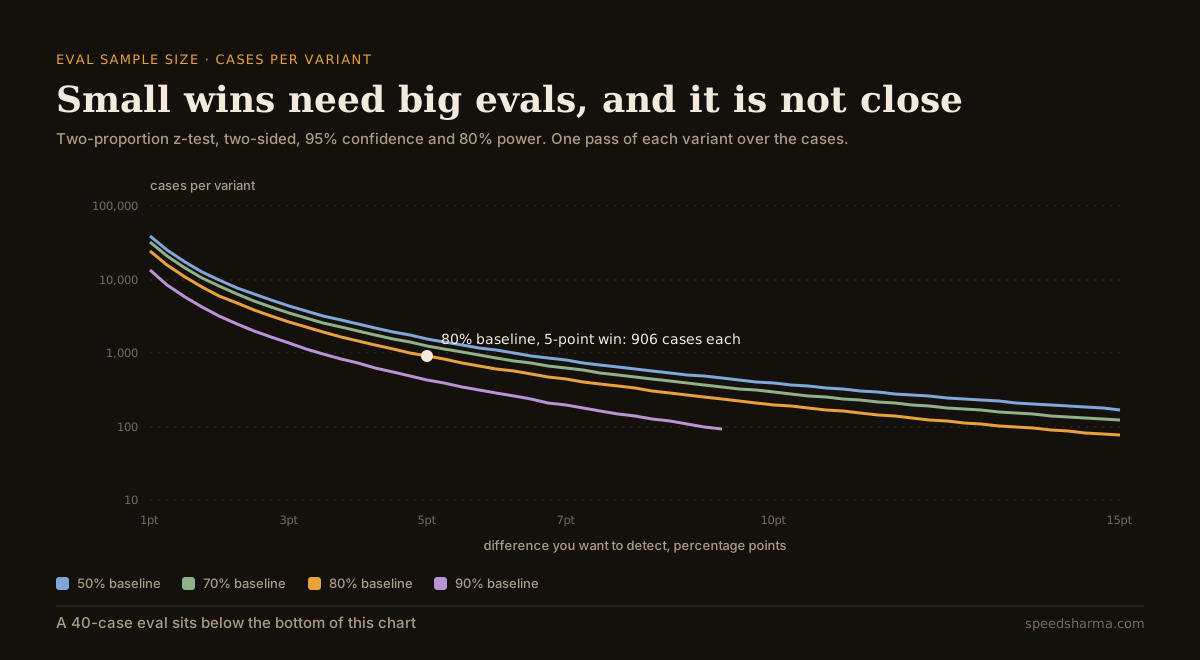
At an 80% baseline, 95% confidence and 80% power, the numbers come out like this:
| Difference to detect | Cases per variant | Total runs |
|---|---|---|
| 10 points, 80% to 90% | 199 | 398 |
| 5 points, 80% to 85% | 906 | 1,812 |
| 3 points, 80% to 83% | 2,629 | 5,258 |
| 2 points, 80% to 82% | 6,039 | 12,078 |
| 1 point, 80% to 81% | 24,641 | 49,282 |
Two things surprise people here. Confidence and power are cheaper than they look: moving from 80% to 90% power takes the 5-point case from 906 to 1,212, and dropping to 90% confidence only saves you down to 714. And the baseline matters: the same 5-point difference needs 1,565 cases from a 50% baseline but only 435 from a 90% one, because variance is largest in the middle.
quick check
Your eval has 100 cases. The current prompt passes 80 of them; a new prompt passes 85. What can you conclude?
At an 80% baseline with 95% confidence and 80% power, 100 cases per variant can only detect a difference of roughly 13 points. A 5-point gap at that size is well inside the noise; you would need about 906 cases per variant to call it.
What each eval size can actually see
Turning the formula around is more useful day to day. Given the eval you have, what is the smallest difference it can resolve?
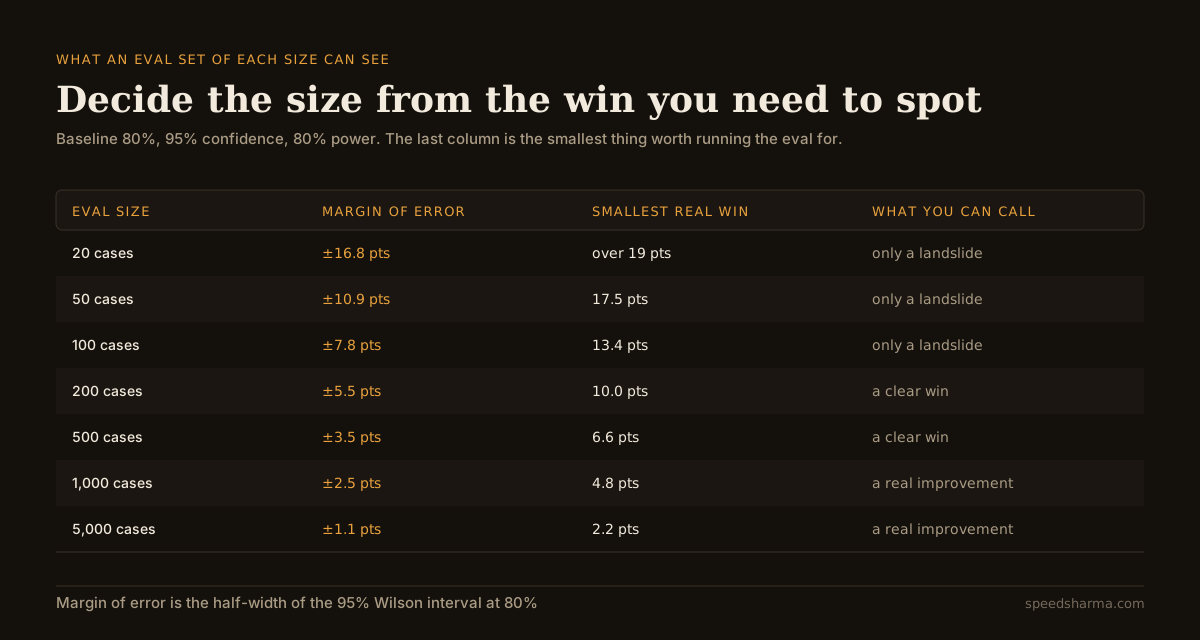
A 200-case eval, which is larger than most I am shown, resolves a 10-point difference. That is fine for the question "did this new model break anything" and useless for the question "is this prompt tweak worth shipping". Decide which question you are asking before you decide the size.
Work out your own numbers
Put in your baseline, the win you care about, and the eval set you already have.
calculator · two-proportion z-test and Wilson intervals
How many test cases does your eval need?
cases per variant to detect a difference of
Uses the pooled two-proportion z-test for sample size and the Wilson score interval for the margin of error, both two-sided. The unpooled form of the sample-size formula gives a number within a few cases of this one. Two assumptions matter: cases are independent, and each is scored pass or fail. Running the same cases against both variants (a paired test) needs fewer cases than this, so treat the number as the conservative one.
The cases cost more than the tokens
The usual objection to a 906-case eval is cost. It is worth checking, because the arithmetic is friendlier than people expect.
Say each case sends 8,000 tokens and gets 600 back. On Claude Sonnet 5 that is about $0.022 a case, so 1,812 runs cost roughly $40. On Claude Haiku 4.5 it is $20. Most of the prompt is the same on every case, so prompt caching takes a large bite out of even that.
Forty dollars is not what stops teams. What stops them is that someone has to write 906 test cases with known-good answers, and keep them current. That is the real budget line, and there are only a few honest ways to reduce it:
- Mine production traffic. Real queries, labelled once by a human, beat invented ones and cost less to produce. This is one of the returns on logging the right things around your LLM calls.
- Reuse the set. An eval set is an asset that pays out on every model change, every prompt change and every provider swap. Amortise it over all of them rather than one experiment.
- Grade, do not just pass or fail. A score from 0 to 1 per case carries more information than a binary, which means lower variance and a smaller n for the same sensitivity. The formulas here assume the binary case, which is the conservative one.
Four ways to get more out of the cases you have
- Compare on the same cases. Run both variants over the identical set and analyse the per-case differences. Because question difficulty is shared, the comparison is paired, and pairing removes variance for free. Evan Miller's Adding Error Bars to Evals makes the point precisely: because scores are positively correlated across models, "paired differences represent a 'free' reduction in estimator variance when comparing two models". The numbers in this post are the unpaired ones, so treat them as an upper bound.
- Stop peeking. Checking after every ten cases and stopping when the new prompt is ahead inflates your false-positive rate well past the 5% you think you chose. Fix the size in advance, or use a sequential test designed for it.
- Count the comparisons. Trying eight prompt variants against one baseline and reporting the winner is eight chances to get lucky. At 95% confidence, one in twenty comparisons of two identical prompts will show a "significant" difference.
- Watch for clusters. Ten questions about the same document are not ten independent cases. Miller's paper shows clustered standard errors coming out up to three times larger than the naive ones, which means a clustered eval is effectively smaller than its case count suggests.
When you genuinely cannot get to 900 cases
Most teams cannot, at least not at first. The answer is not to pretend the small eval decides things.
- Raise the bar. If your eval can only see 13 points, then only act on wins of 13 points or more, and say so out loud when you report the result.
- Use it as a regression gate. A 50-case eval is good at catching a change that broke something badly. Treat a big drop as a stop signal and a small rise as no information.
- Split the eval by category. Twenty cases each across five categories will not give you a significant total, but "every failure is in the refunds category" is a real finding that does not need statistics.
- Let production decide. Ship behind a flag, compare on live traffic, and use the eval to make sure you are not shipping something obviously broken. Your traffic has a much larger sample size than your eval will ever have.
The cost of getting this wrong is not embarrassment, it is a team that spends a quarter tuning prompts against noise. That time has a price, and it is a lot more than the tokens; the same logic that applies to pricing an AI feature per user applies to the hours spent tuning it.
questions people ask
How many test cases does an LLM eval need?
It depends on the difference you want to detect. From an 80% baseline at 95% confidence and 80% power, you need about 199 cases per variant to detect a 10-point change, 906 for 5 points and 2,629 for 3 points.
Is a 100-case LLM eval enough?
For catching large regressions, yes. For comparing two prompts, only if the difference is around 13 points or more. Smaller differences on 100 cases are indistinguishable from random variation.
How do I calculate the confidence interval for a pass rate?
Use the Wilson score interval rather than the textbook normal approximation, because it behaves properly for small samples and for rates near 0% or 100%. At 80% on 100 cases it gives 71.1% to 86.7%.
What is statistical power in an eval?
The probability of detecting a real difference of the size you specified. At the usual 80% power, one real improvement in five will be missed, which is the trade you make to keep the eval affordable.
Does running the same cases for both variants help?
Yes. A paired comparison removes the variance that comes from some questions being harder than others, so it needs fewer cases than the unpaired formulas here.
Why did my eval score change when I ran it again?
Sampling noise if the cases changed, and model nondeterminism if they did not. Fix the sampling temperature and seed where you can, run the whole set for each variant, and report an interval with the score.
The short version
An eval score is a sample, so report it with an interval. Wilson, not the normal approximation, because your pass rates are high and your samples are small.
Before comparing two variants, work out what your eval can see. From an 80% baseline, 100 cases resolve about 13 points, 500 resolve 6.6, and 906 are needed for a 5-point call at the usual confidence and power. If your eval is smaller than that, either raise the threshold you will act on, or stop treating the eval as the decision-maker.
The tokens are not the constraint: 1,812 runs cost about $40 on a mid-sized model. The constraint is cases with known answers, so mine them from production, reuse them across every change, and score them on a scale rather than a coin flip.