An LLM call fails differently from a database call. A database either answers, errors or times out. A model call returns 200 OK with an answer that is wrong, or slow, or five times more expensive than the one before it, and your access log records the same thing in all four cases: POST /api/ask 200 3140ms.
That is why the usual instrumentation misses. The questions people ask after an LLM feature misbehaves are specific. Which model actually served it, given the fallback chain. How big was the prompt by the time retrieval and history were glued on. How much of it came from cache. Why did the model stop where it did. What did that one call cost, and which user and feature should carry it. None of those are in a duration and a status code.
I contribute to litellm, mostly on streaming fallback correctness, which is a good vantage point for seeing how many ways a model call can half-succeed: a stream that stops mid-sentence, a fallback that quietly answers on a different model, a tool call that returns nothing. Every one of those is invisible unless something recorded the details at the time.
What a model call has to tell you
Before picking a vendor, decide what each call must record. The questions on the left are the ones asked during an incident; the attributes on the right are where the answers live.
| Question during an incident | Where the answer lives |
|---|---|
| Which model answered, and was it the one we asked for? | gen_ai.request.model, gen_ai.response.model |
| How large was the prompt, and how much came from cache? | gen_ai.usage.input_tokens, gen_ai.usage.cache_read.input_tokens |
| How much did it write, and why did it stop? | gen_ai.usage.output_tokens, gen_ai.response.finish_reasons |
| How long until the first token? | gen_ai.response.time_to_first_chunk |
| What did it cost, and who should carry it? | your own attributes, such as app.cost_usd and app.feature |
| Did it fail, and how? | error.type and the span status |
The last row is worth dwelling on. A model call that returns an answer nobody can use is not an error by any HTTP definition, so you decide what counts: an empty completion, a refusal, a tool call with malformed arguments, a response that failed schema validation. If your code knows, the span should say so.
The GenAI conventions, and their status
OpenTelemetry has standard names for most of this now, in a dedicated GenAI semantic conventions repository split out from the main one. Read that before inventing attribute names, and note that everything in the gen_ai.* namespace is still marked Development, which means names can change between releases.
The shape is straightforward. An inference span's name "SHOULD be {gen_ai.operation.name} {gen_ai.request.model}" and its kind is CLIENT. Two attributes are Required: gen_ai.operation.name and gen_ai.provider.name. Well-known operation names include chat, embeddings, retrieval, execute_tool and invoke_agent; well-known provider names include anthropic, openai and gcp.gemini. If you instrumented an LLM app a couple of years ago you may have gen_ai.system, which has since been replaced by gen_ai.provider.name.
The other span types follow the same pattern. A retrieval span "SHOULD be {gen_ai.operation.name} {gen_ai.data_source.id}" and a tool execution span "SHOULD be execute_tool {gen_ai.tool.name}", which is how one request turns into a small readable trace rather than one opaque box.
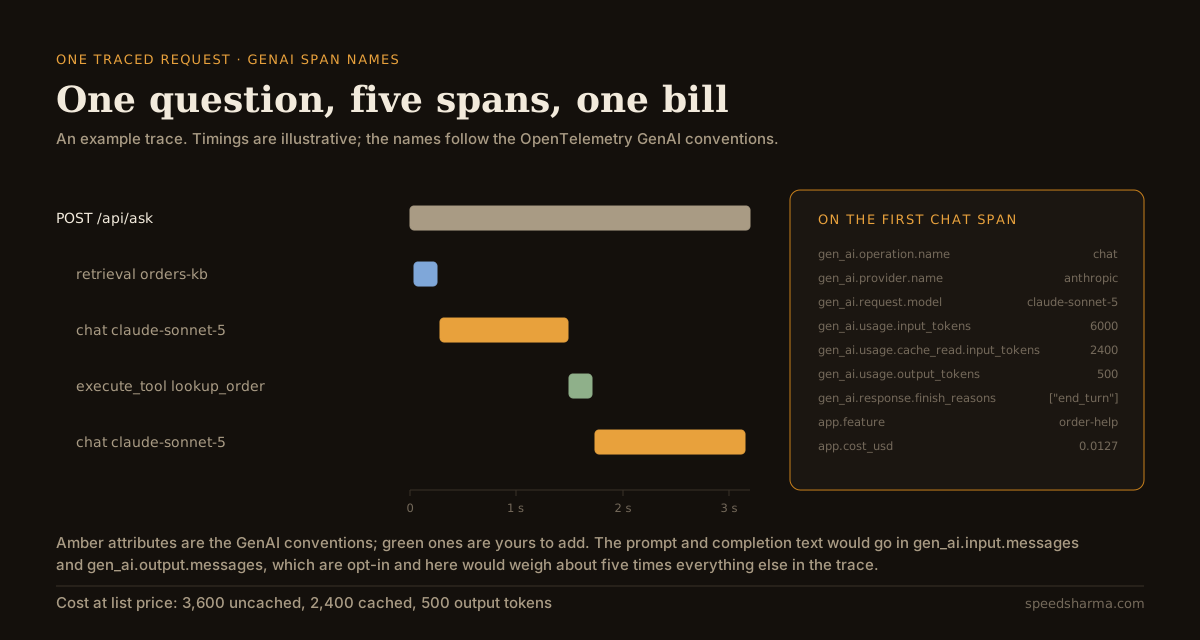
There is a trap worth knowing where the conventions meet a provider's API. The registry says gen_ai.usage.input_tokens "SHOULD include all types of input tokens, including cached tokens". Anthropic's API reports them separately: its prompt caching documentation defines input_tokens as the tokens "which were not read from or used to create a cache", with the total being cache_read_input_tokens + cache_creation_input_tokens + input_tokens. Copy usage.input_tokens straight onto the span and every cached call will look small, your token dashboards will disagree with your invoice, and the cache will look like it did nothing.
Instrumenting one call
Here is the whole thing for the Anthropic SDK: conventional names, the token arithmetic above, cost at current list prices, and an attribute for the feature so the spend can be grouped later.
import anthropic
from opentelemetry import trace
from opentelemetry.trace import SpanKind, Status, StatusCode

tracer = trace.get_tracer("assistant")
client = anthropic.Anthropic()

# USD per million tokens, from the provider's pricing page. Check it quarterly.
PRICES = {
    "claude-sonnet-5":  {"input": 2.00, "cache_read": 0.20, "cache_write": 2.50, "output": 10.00},
    "claude-haiku-4-5": {"input": 1.00, "cache_read": 0.10, "cache_write": 1.25, "output": 5.00},
}


def cost_usd(model: str, usage) -> float:
    p = PRICES[model]
    return (
        usage.input_tokens * p["input"]
        + (usage.cache_read_input_tokens or 0) * p["cache_read"]
        + (usage.cache_creation_input_tokens or 0) * p["cache_write"]
        + usage.output_tokens * p["output"]
    ) / 1_000_000


def ask(messages: list[dict], *, user_id: str, feature: str, model: str = "claude-sonnet-5"):
    with tracer.start_as_current_span(f"chat {model}", kind=SpanKind.CLIENT) as span:
        span.set_attributes({
            "gen_ai.operation.name": "chat",
            "gen_ai.provider.name": "anthropic",
            "gen_ai.request.model": model,
            "gen_ai.request.max_tokens": 1024,
            "app.feature": feature,
            "app.user_id": user_id,
        })
        try:
            response = client.messages.create(model=model, max_tokens=1024, messages=messages)
        except anthropic.APIError as err:
            span.set_attribute("error.type", type(err).__name__)
            span.set_status(Status(StatusCode.ERROR, str(err)))
            raise

        usage = response.usage
        cached = usage.cache_read_input_tokens or 0
        written = usage.cache_creation_input_tokens or 0

        span.set_attributes({
            "gen_ai.response.model": response.model,
            "gen_ai.response.id": response.id,
            "gen_ai.response.finish_reasons": [response.stop_reason or "unknown"],
            # The convention's input_tokens includes cached tokens; Anthropic's does not.
            "gen_ai.usage.input_tokens": usage.input_tokens + cached + written,
            "gen_ai.usage.cache_read.input_tokens": cached,
            "gen_ai.usage.cache_write.input_tokens": written,
            "gen_ai.usage.output_tokens": usage.output_tokens,
            "app.cost_usd": round(cost_usd(model, usage), 6),
        })
        return response
Prices live in one dictionary rather than scattered through the code, because they change: Claude Sonnet 5's $2 and $10 per million tokens were introductory at launch and are now the standard price, and a scheduled rise to $3 and $15 was cancelled. Anything that reads a price from a literal buried in a call site will be wrong within a year and wrong silently.
quick check
A Claude Sonnet 5 call returns usage of input_tokens 1,200, cache_read_input_tokens 4,800 and output_tokens 500. At $2 per million input, $0.20 cached and $10 output, what did the call cost, and what should gen_ai.usage.input_tokens say?
The prompt was 6,000 tokens, of which 4,800 were cache reads: 1,200 x $2 + 4,800 x $0.20 + 500 x $10, all per million, is $0.00836. Pricing the 1,200 alone undercounts by 11%; pricing all 6,000 at the full input rate doubles the figure. The convention's input_tokens includes cached tokens, so it is 6,000.
Prompts are most of the bytes
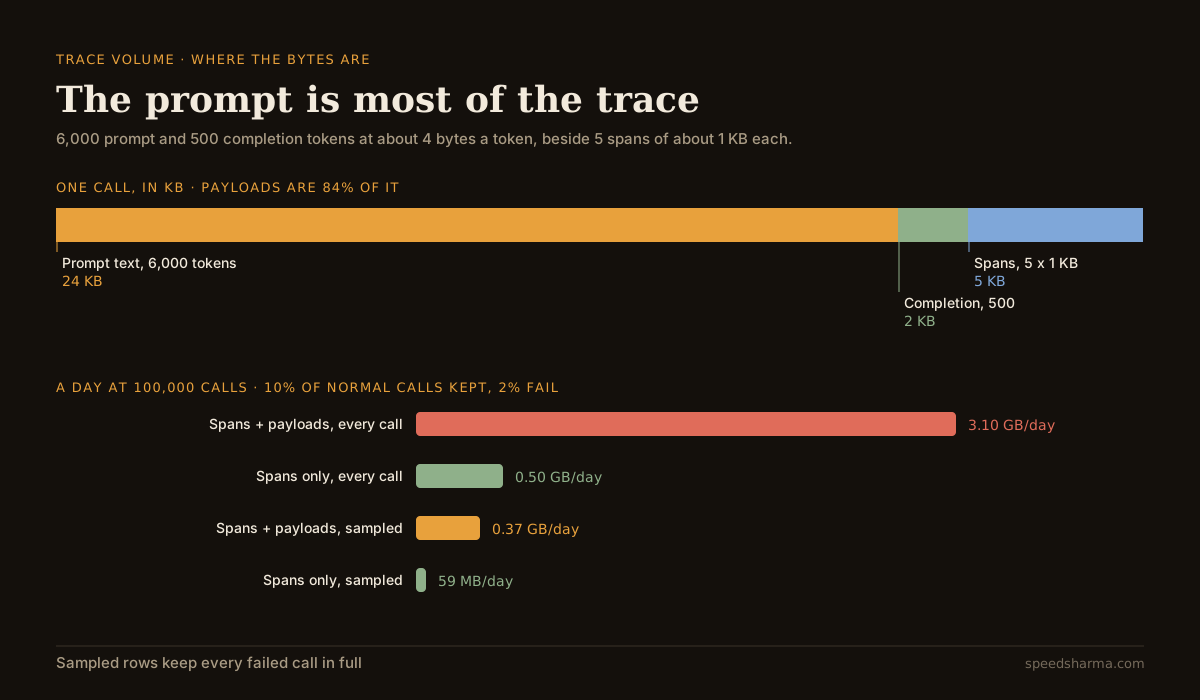
A span without payloads is small: attributes, timings, IDs and resource metadata, on the order of a kilobyte. The prompt and completion are a different quantity entirely. Tokens convert to characters at roughly four to one in English, which both Anthropic ("1 token is approximately 4 characters or 0.75 words in English") and Google ("a token is equivalent to about 4 characters") give as the rule of thumb. Treat it as an approximation: Anthropic notes that its newer models use a tokenizer producing about 30% more tokens for the same text, and non-Latin scripts cost more bytes per character in UTF-8 than English does.
For the example feature: five spans of about 1 KB is 5 KB per call, while 6,000 prompt and 500 completion tokens is about 26 KB. The payload is 84% of what you would store.
The conventions treat that text with more caution than most teams do. gen_ai.input.messages, gen_ai.output.messages, gen_ai.system_instructions and gen_ai.tool.definitions are all marked Opt-In, with the note that they are "likely to contain sensitive information" and that "instrumentations SHOULD NOT capture this attribute by default". The Python implementation follows through: the GenAI utility package defaults OTEL_INSTRUMENTATION_GENAI_CAPTURE_MESSAGE_CONTENT to NO_CONTENT, with SPAN_ONLY, EVENT_ONLY and SPAN_AND_EVENT as the opt-ins.
There is also a documented path for keeping payloads out of your tracing vendor: an upload hook, configured with OTEL_INSTRUMENTATION_GENAI_UPLOAD_BASE_PATH, that writes the content to storage you control. Read the detail before relying on it, because the spec says instrumentations "SHOULD invoke it regardless of the span sampling decision" — the hook uploads everything unless your implementation samples too.
Work out your own trace volume
Put in your own call rate, span count and prompt sizes. The model list and prices come from the same data as the LLM cost per user calculator, checked against each provider's pricing page.
calculator · trace volume, model prices per 1M tokens checked 12 Sep 2026
What tracing your LLM calls will store, and what each call costs
trace data a day
where one call's model cost goes
GB here is 109 bytes and a month is 30 days. Payload size assumes about 4 bytes per token, which holds for English prose and runs higher for JSON wrapping and non-Latin scripts. Model cost counts tokens at list price: cached input at the cache-read rate, no cache writes, batch discounts or long-context surcharges. Some tracing tools bill per span or per trace rather than per GB.
Run it once with payloads on and once with them off. The gap is not usually a money decision.
Sampling that keeps the calls you will be asked about
Volume control here is the same argument as in ordinary logging, with one extra constraint: the OpenTelemetry SDK's sampler decides at span start, before you know whether the call was slow, expensive or wrong. Head sampling, in OpenTelemetry's terms, "cannot evaluate entire traces", so it cannot guarantee you keep the failures.
Two mechanisms fix it, and most teams want both.
The first is tail sampling in the Collector, which buffers a trace and decides once it is complete. The tail sampling processor takes policies that combine with OR, so anything matching one policy is kept:
processors:
  tail_sampling:
    decision_wait: 10s
    num_traces: 50000
    policies:
      [
        { name: keep-errors, type: status_code, status_code: { status_codes: [ERROR] } },
        { name: keep-slow, type: latency, latency: { threshold_ms: 5000 } },
        { name: sample-the-rest, type: probabilistic, probabilistic: { sampling_percentage: 10 } },
      ]
The processor is beta, and it comes with an operational rule that catches people out when they scale the Collector horizontally: "All spans for a given trace MUST be received by the same collector instance for effective sampling decisions", which means a load balancing exporter in front of it.
The second is deciding in-process what to attach, which is where payload capture belongs. The span itself is cheap, so record all of them and let the Collector thin them out; the prompt is expensive in every sense, so attach it only when you will want to read it.
import json
import random

PAYLOAD_RATE = 0.10


def to_parts(role: str, text: str) -> dict:
    return {"role": role, "parts": [{"type": "text", "content": text}]}


def attach_payloads(span, messages: list[dict], response, failed: bool) -> None:
    """Prompt and completion text: every failure, a sample of the rest."""
    if not failed and random.random() >= PAYLOAD_RATE:
        return

    inputs = [to_parts(m["role"], redact(m["content"])) for m in messages]
    outputs = [to_parts("assistant", redact("".join(b.text for b in response.content if b.type == "text")))]

    # Structured attributes are not supported on spans everywhere yet; the
    # convention says to serialise to a JSON string where they are not.
    span.set_attribute("gen_ai.input.messages", json.dumps(inputs))
    span.set_attribute("gen_ai.output.messages", json.dumps(outputs))
    span.set_attribute("app.payload_sample_rate", 1.0 if failed else PAYLOAD_RATE)
Whatever redact does in your codebase, write it before you turn payload capture on, not after someone notices a customer's phone number in a trace. And set retention on the payload attributes deliberately: a sampled 0.37 GB a day still means around 11 GB of your users' words held for a month.
Attributing cost without lying to yourself
Once cost is on the span, the obvious move is to sum it by feature in your tracing tool. That works right up until you sample, at which point the sum is of the sampled traces, not the traffic. If you sample at 10%, your reported spend is a tenth of the invoice, and nobody notices until finance asks.
Two habits keep the numbers honest. First, record spend as a metric, which is not sampled, alongside the span. The conventions define gen_ai.client.token.usage as a Histogram of tokens with a gen_ai.token.type attribute of input or output, and gen_ai.client.operation.duration as a Histogram in seconds; your own cost counter sits naturally next to them.
from opentelemetry import metrics

meter = metrics.get_meter("assistant")
spend = meter.create_counter("app.llm.cost", unit="USD")

spend.add(cost, {"gen_ai.request.model": model, "app.feature": feature})
Keep user IDs off that counter. Metrics dimensions multiply into time series, and a per-user label on a busy product is how a metrics bill overtakes the model bill.
Which leads to the second habit: per-user cost is billing data, not telemetry. Write one row per call to your own store, with user, feature, model, the three token counts and the cost, and query it like any other table. It survives sampling, it survives changing observability vendor, and it is the thing you need when deciding whether a plan's price works. That is the arithmetic in LLM cost per user, and traces are how you populate it from production rather than guessing.
Here is what the same example feature costs per call across the current list prices, at 6,000 prompt tokens with 40% cached and 500 completion tokens.
| Model | Cost per call | At 100,000 calls a day |
|---|---|---|
| Claude Opus 5 | $0.0317 | $95,100 a month |
| Claude Sonnet 5 | $0.0127 | $38,040 a month |
| Claude Haiku 4.5 | $0.0063 | $19,020 a month |
| Gemini 3.8 Flash (introductory) | $0.0047 | $14,265 a month |
| GPT-5.6 Luna | $0.0014 | $4,104 a month |
Against any row in that table, the traces are small. Keeping every span and every payload at an example $0.50 per GB is about $47 a month, roughly 0.1% of the Sonnet 5 spend, and about 1% even on the cheapest model in the list. Storage is not the reason to sample payloads. The reasons are that prompts contain people's data, and that nobody has ever read the ten-thousandth successful prompt.
Alerts that explain themselves
The failure mode worth alerting on is rarely a hard error. It is cost per call drifting upward because retrieval started returning more chunks, or because an agent quietly gained a step, or because a user found a way to paste an entire PDF into a text box.
A rolling comparison catches that without a statistics library: track cost per call over a window and compare the recent slice to the older one.
from collections import deque

recent = deque(maxlen=500)


def check_cost(cost: float, attrs: dict) -> str | None:
    recent.append((cost, attrs))
    if len(recent) < 200:
        return None

    costs = [c for c, _ in recent]
    baseline = sum(costs[:100]) / 100
    now = sum(costs[-100:]) / 100
    if baseline <= 0 or now < baseline * 2:
        return None

    worst = max(recent, key=lambda r: r[0])
    return (
        f"Cost per call is {now / baseline:.1f}x baseline "
        f"({now:.4f} vs {baseline:.4f} USD). "
        f"Worst call: feature={worst[1]['app.feature']} model={worst[1]['gen_ai.request.model']} "
        f"prompt_tokens={worst[1]['gen_ai.usage.input_tokens']} "
        f"cached={worst[1]['gen_ai.usage.cache_read.input_tokens']} "
        f"finish={worst[1]['gen_ai.response.finish_reasons'][0]}"
    )
The comparison is ordinary. What matters is the second half of the message. An alert that says "cost anomaly detected" sends someone to a dashboard; an alert that names the feature, the model, the prompt size, the cache hit rate and the finish reason often ends the investigation in the notification itself. That is the rule I hold to on PostEngage, where there is nobody else to ask at 2am: if a system cannot explain its own failure in the alert it sends, it is not finished.
Three more alerts earn their place: cache hit rate falling, which usually means someone put a timestamp near the top of the prompt and broke the cache prefix; time to first token at the 95th percentile, because it is what users feel; and the rate of unexpected finish reasons, which is how truncation shows up before support tickets do.
questions people ask
What is LLM observability?
Recording enough about each model call to answer questions afterwards: which model served it, how many input, cached and output tokens it used, how long it took, why it stopped, what it cost, and which user and feature it belonged to. In practice it is tracing plus token and cost attribution, not error logs.
What are the OpenTelemetry GenAI semantic conventions?
Standard attribute and span names for model calls, such as gen_ai.operation.name, gen_ai.provider.name, gen_ai.request.model and gen_ai.usage.input_tokens. They live in their own repository, and the gen_ai namespace is still marked Development, so pin the version you code against.
Should I log prompts and completions in production?
Not by default. The conventions mark message content Opt-In because it is likely to hold personal data, and the Python instrumentation defaults to NO_CONTENT. Capture it for failed calls and a small sample of the rest, redact it first, and give it a shorter retention than the rest of your traces.
How do I track LLM cost per user?
Compute cost from the token counts in each response, put it on the span for debugging, and write a row per call to your own database with user, feature, model, tokens and cost. Do not sum sampled spans for billing figures, and avoid per-user labels on metrics, where cardinality gets expensive.
How much does it cost to trace LLM calls?
Less than most people expect. At 100,000 calls a day with five spans of about 1 KB and full payloads, it is about 3.1 GB a day, roughly $47 a month at an example $0.50 per GB, against about $38,040 of Claude Sonnet 5 spend for the same calls.
What is the difference between head and tail sampling?
Head sampling decides when a trace starts, so it cannot know whether the trace ended in an error; tail sampling buffers the whole trace and then decides, which is what lets you keep every failure. Tail sampling needs a stateful component, and every span of a trace must reach the same Collector instance.
The short version
Wrap every model call in a span, use the GenAI conventions for the names, and add cost, feature and user yourself. Get the token arithmetic right: cached tokens are counted separately by the provider and together by the convention, and confusing the two makes caching look useless and your dashboards disagree with your invoice.
Record all the spans and thin them in the Collector, where a tail sampling policy can keep every error and every slow trace. Treat prompt and completion text as a separate decision: it is most of the bytes, it is all of the risk, and it is worth keeping for failures and a small sample of everything else.
Then put the cost somewhere that sampling cannot distort, because the question this all exists to answer is not "is the service up". It is whether the feature makes money at the price you charge for it.