Open the log viewer during an incident on a young backend and the problem is never that there is too little. Health probes from the load balancer and the orchestrator, arriving every few seconds, forever. A line for every cache get and every cache set. SQL text at INFO. "Request received" and "response sent" for every call, with the interesting facts in neither. Somewhere in that stream is the line that explains why checkout is failing, and searching for the word "error" returns thousands of matches, most of them from a retry that healed itself an hour ago.
This is the noise problem, and it bills you twice. Once on the invoice, because log vendors charge by the gigabyte ingested. Once during the incident, because every line that answers no question is a line someone scrolls past at 2am while the customer waits.
The fix is not "log less". A service that logs nothing is worse. The fix is to change the shape of what you log: fewer lines, each carrying far more, with the boring successful requests sampled and every failure kept in full.
I run PostEngage alone, and the rule I hold to there is that if a system cannot explain its own failure in the alert it sends, it is not finished. Logs are where that explanation comes from. Most logging setups cannot give it, not because they record too little, but because what they record is scattered across a dozen lines and mixed with everyone else's.
What the noise actually looks like
Three patterns produce most of the volume in a typical Node service. Each one looked sensible when it was written.
// The load balancer and the orchestrator both probe this, every few seconds
app.get('/health', (req, res) => {
  logger.info('Health check requested')
  res.json({ status: 'ok' })
  logger.info('Health check completed')
})

// SQL at INFO, with the identifier pasted into the message string
async function getUser(id: string) {
  logger.info(`Executing query: SELECT * FROM users WHERE id = '${id}'`)
  const user = await db.query('SELECT * FROM users WHERE id = $1', [id])
  logger.info(`Query returned ${user.rows.length} rows`)
  return user.rows[0]
}

// Every cache operation, twice
async function getCached(key: string) {
  logger.info(`Cache GET: ${key}`)
  const val = await redis.get(key)
  logger.info(`Cache ${val ? 'HIT' : 'MISS'}: ${key}`)
  return val
}
The health check pair is pure volume: two lines several times a second that say the process is alive, which your uptime monitor already knows. The query logging puts user identifiers into a free-text message, which means it is both unqueryable and a small data leak into a system with wider access than your database. The cache lines fire on the hottest path in the service.
The deeper problem is the shape. Every fact here is embedded in an English sentence. To answer "which users saw a slow query in the last hour", you need a regular expression over message strings, and you need the user ID from one line to be joined to the duration on another line, which may have been dropped by a sampler that did not know they belonged together.
This is what people mean by string soup. The alternative, structured logging, is not merely "log JSON": it is that every value you might want to filter or group by is its own field.
Where the gigabytes come from
The arithmetic is simple enough to do in your head, which is why it is worth doing before you negotiate with a vendor.
bytes a day = requests/s x lines per request x bytes per line x 86,400

200 x 12 x 350 x 86,400 = 72.6 GB a day  (about 2,177 GB a month)
Three changes, applied in order, to the same service. Dropping the noise removes 40% of the lines. Sampling keeps 10% of successful requests and all of the 1% that fail. The canonical line replaces what survives with one wide line per request, and failed requests keep their detail lines as well.
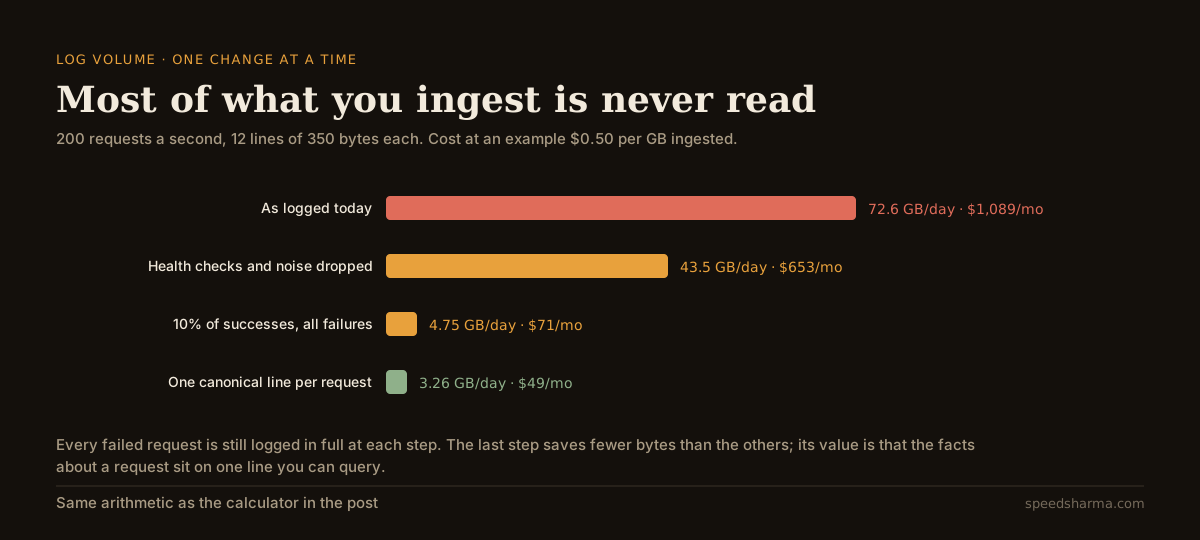
The price used there is an example of $0.50 per GB ingested, not any vendor's rate; put your own contract's number into the calculator below. What matters more than the exact rate is the ratio. The last step, the canonical line, saves the fewest bytes of the three. Its value is not on the invoice.
Work out your own volume
Two honest ways to get the inputs. Either run one representative request through staging with the production log level set and count the lines it emits, or take an hour of real logs, divide total bytes by total requests, and divide that by your line count.
calculator · log volume and ingest cost
How much are you logging, and how much of it do you need?
GB a day, one change at a time
GB here is 109 bytes and a month is 30 days. Sampling is decided once per request, so a kept request keeps all its lines. Ingest price only: many vendors also bill for retention beyond an included period, for indexing, or per event instead of per GB, so convert your plan to a per-GB figure before trusting the cost line.
If the result is far above what you expected, the usual culprit is a line inside a loop: one per message consumed, one per row processed, one per retry. In real-time systems this is easy to do by accident. The Interaction Hub I work on at Acefone moves events over Kafka, Redis and Socket.io, and a single log line per event is a line multiplied by every event in the system, which is a very different quantity from one line per user action.
Levels are a promise about who reads the line
A log level is not a severity ranking for your own satisfaction. It is a routing decision about which human sees it and when.
| Level | Who reads it | When | Belongs here |
|---|---|---|---|
| error | the on-call engineer | now, it pages | payment capture failed after every retry |
| warn | someone on the team | today | provider was slow, the retry succeeded |
| info | a query, weeks later | during an investigation | order placed, user upgraded, the canonical line |
| debug | a developer | switched on deliberately | SQL text, cache hits, internal state |
Pino's default level is info, and its levels map to numbers: trace 10, debug 20, info 30, warn 40, error 50, fatal 60. Anything below the configured level costs nothing, which is why debug lines are safe to leave in the code and expensive to leave enabled.
The discipline that matters: if ERROR fires for something nobody acts on, people stop reading ERROR. A warning nobody reviews is noise with a sterner name.
Cut the noise before it leaves the process
The cheapest work is filtering at the source, and in a Node service it is a few lines of configuration. pino-http documents autoLogging.ignore as function (req, res) => { returns boolean }, and customLogLevel as a function whose returned level name decides how the automatic line is written, where returning silent prevents logging.
import pino from 'pino'
import pinoHttp from 'pino-http'

const logger = pino({
  level: process.env.LOG_LEVEL ?? 'info',
  redact: ['req.headers.authorization', 'req.headers.cookie', 'user.email'],
})

const probes = new Set(['/health', '/ready', '/metrics'])

app.use(pinoHttp({
  logger,
  autoLogging: { ignore: (req) => probes.has((req.url ?? '').split('?')[0]) },
  customLogLevel: (req, res, err) => {
    if (err || res.statusCode >= 500) return 'error'
    if (res.statusCode >= 400) return 'warn'
    if (res.statusCode >= 300) return 'silent'
    return 'info'
  },
}))
The redact option there is worth its own paragraph. Pino's redaction docs take an array of paths or an object with paths, censor (default "[Redacted]") and remove, and support wildcards like a[*].b. The docs also note the cost: non-wildcard redaction is around 2% overhead, while wildcard redaction is "a non-trivial cost relative to explicitly declaring the keys (50% in a case where four keys are redacted across two objects)". Name the paths you know rather than reaching for wildcards, and remember redaction only protects the fields you thought of, which is an argument for never putting raw request bodies in a log line at all.
Sample by request, never by line
Once the noise is gone, the remaining volume is mostly successful requests that behaved exactly as designed. Sampling those is reasonable. Sampling them wrongly is worse than not sampling.
Per-line sampling, where each line independently survives with some probability, gives you fragments: the "payment started" line without the "payment failed" line, a duration with no route. Decide once per request, and decide at the end, when you know the status code, the duration and whether anything threw.
This is the same shape as the distinction OpenTelemetry draws for traces. Their sampling guide describes head sampling as deciding early, which "cannot evaluate entire traces", and tail sampling as evaluating a complete trace first, so that "always sampling traces that contain an error" becomes possible. The cost of tail sampling there is infrastructure: the component doing it "must be stateful systems that can accept and store a large amount of data". Inside a single process, at the end of a single request, you get the useful half of that for free, because the process already holds the whole request.
Three rules cover most services:
- Keep every failed request, at 100%. This includes 5xx, unhandled exceptions, and anything you have decided is a business failure, such as a payment declined by the provider.
- Keep every slow request, above a threshold you have agreed is the budget for that route.
- Keep a fixed share of the rest, and write the rate onto the line.
That third point carries more weight than it looks. If you keep 10% of successes and all failures, then count lines naively, your dashboard will show a far worse error rate than reality.
quick check
You keep 10% of successful requests and every failed one, and each line records its own sample_rate. In one minute you see 1,188 successful lines with sample_rate 0.1 and 120 failed lines with sample_rate 1. How many requests did the service actually handle in that minute?
Each kept line stands for 1 divided by its sample rate. 1,188 x 10 plus 120 x 1 is 12,000, which is 200 requests a second with a 1% failure rate. Counting the 1,308 visible lines instead would put your error rate at 9%, nine times the truth.
One canonical line per request
The pattern that changes incidents most is one wide line per request per service, written at the end, carrying everything worth knowing. Stripe published theirs in Brandur Leach's 2019 post on canonical log lines: a single information-dense entry per request, with HTTP details, authentication, rate limit state, timings, query counts and business identifiers together, rather than spread over many small lines. The reason they give is the one that matters at 2am: "By colocating everything that's important to us, we make it accessible through queries that are easy for people to write, even under the duress of a production incident."
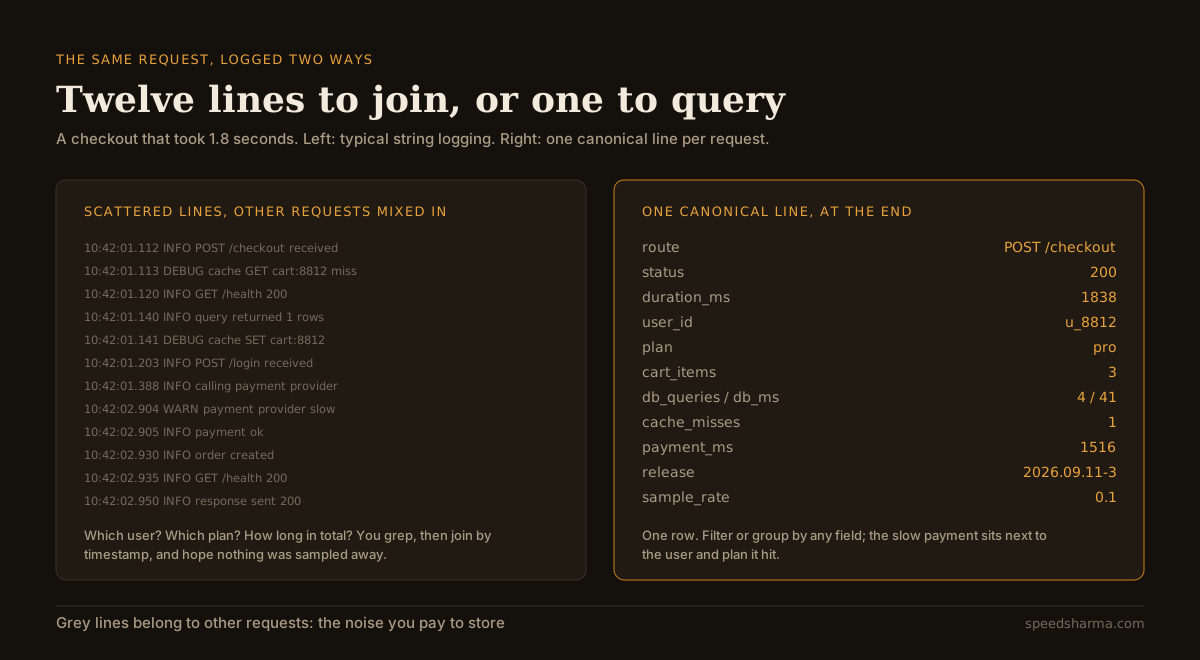
This is also the idea behind what Charity Majors calls observability 2.0: "arbitrarily-wide structured log events, a single source of truth", as against the three-pillars generation of metrics, logs and traces stored separately. Her cost argument is the one to take to a budget conversation: in the older model "you pay to store your data again and again, multiplied by all the different formats and tool types", while wide events mean you "pay to store your data once".
I wrote Logixia, an open-source TypeScript logger, around this shape: wide events and canonical lines rather than string soup, with OTLP export, redaction and adaptive sampling built in. You do not need it to adopt the pattern. Here it is in about forty lines with pino and AsyncLocalStorage.
import { AsyncLocalStorage } from 'node:async_hooks'
import { randomUUID } from 'node:crypto'
import type { NextFunction, Request, Response } from 'express'
import pino from 'pino'

const logger = pino({ redact: ['user_email'] })
const current = new AsyncLocalStorage<Record<string, unknown>>()

const SAMPLE_RATE = Number(process.env.LOG_SAMPLE_RATE ?? 0.1)
const SLOW_MS = 1000

// Callable from anywhere inside the request: add facts to this request's line.
export function annotate(fields: Record<string, unknown>) {
  Object.assign(current.getStore() ?? {}, fields)
}

export function canonicalLine(req: Request, res: Response, next: NextFunction) {
  const started = performance.now()
  const line: Record<string, unknown> = {
    request_id: req.get('x-request-id') ?? randomUUID(),
    method: req.method,
  }

  // 'close' fires whether the response finished or the client gave up.
  res.on('close', () => {
    line.route = req.route ? req.baseUrl + req.route.path : 'unmatched'
    line.status = res.statusCode
    line.duration_ms = Math.round(performance.now() - started)
    line.aborted = !res.writableFinished

    const failed = res.statusCode >= 500 || 'error' in line
    const slow = (line.duration_ms as number) >= SLOW_MS
    if (!failed && !slow && Math.random() >= SAMPLE_RATE) return

    line.sample_rate = failed || slow ? 1 : SAMPLE_RATE
    logger[failed ? 'error' : 'info'](line, 'canonical')
  })

  current.run(line, next)
}
Using it is the part that makes handlers readable, because nothing logs mid-request; it just contributes facts.
app.use(canonicalLine)

app.post('/checkout', async (req, res) => {
  annotate({ user_id: req.user.id, plan: req.user.plan, cart_items: req.body.items.length })

  const started = performance.now()
  const payment = await payments.capture(req.body)
  annotate({ payment_ms: Math.round(performance.now() - started), payment_status: payment.status })

  res.json({ ok: true })
})

app.use((err: Error, req: Request, res: Response, _next: NextFunction) => {
  annotate({ error: err.name, error_message: err.message })
  res.status(500).json({ error: 'internal' })
})
Two refinements worth knowing. First, if you want the detailed debug lines for failures, buffer them on the same store and flush them only when the request fails; that is what the calculator's canonical option assumes, and it is why failed requests cost more bytes there. Second, put your trace ID on the line if you run OpenTelemetry, so one field takes you from the log to the trace and back.
What to keep at full volume
Sampling is a decision about which stories you are willing not to be able to tell. Some stories you must always be able to tell.
| Sample it, or drop it | Keep every one |
|---|---|
| Health, readiness and metrics probes | Every 5xx and every unhandled exception |
| Successful reads on busy routes | Requests slower than the route's budget |
| Cache hits and misses as separate lines | Payments, refunds, sign-ups, plan changes |
| SQL text for queries that succeeded | Anything a customer might later dispute |
| "Request received" and "response sent" pairs | Rare routes, where a 10% sample leaves nothing |
Rare routes deserve a second look. A 10% sample of a route that gets thirty requests a day gives you three lines, which is nothing when someone asks why that route broke last Tuesday. Sample by route with a floor, or keep low-traffic routes entirely.
Turning the volume up during an incident
If debug logging is off in production, you need a way to switch it on for fifteen minutes without a deploy. Pino exposes logger.level as a getter and setter, so this is a small admin endpoint, with two details that are usually missing.
const LEVELS = new Set(['error', 'warn', 'info', 'debug'])
let revert: NodeJS.Timeout | undefined

app.post('/admin/log-level', requireAdmin, (req, res) => {
  const { level, minutes = 15 } = req.body
  if (!LEVELS.has(level)) return res.status(400).json({ error: 'invalid level' })

  logger.level = level
  clearTimeout(revert)
  revert = setTimeout(() => {
    logger.level = process.env.LOG_LEVEL ?? 'info'
    logger.warn('log level reverted')
  }, minutes * 60_000)
  revert.unref()

  logger.warn({ level, minutes }, 'log level changed')
  res.json({ level, reverts_in_minutes: minutes })
})
The timer is the first detail: debug logging left on after an incident is how a log bill doubles quietly. The second is that this only changes the process that received the request. With more than one instance behind a load balancer, you need the change pushed to all of them, through your config service or a Redis pub/sub channel that every instance subscribes to. A dial that adjusts one of twelve pods during an incident is worse than no dial, because you will believe you turned it on.
It is also worth alerting on log volume itself. A sudden doubling is almost always a bug: a retry loop that found a new way to fail, a log line added inside a hot path, or a queue backlog that is being retried and logged on every pass.
A week of work, in order
- Measure. Bytes a day, lines per request, and the ten message templates that produce the most volume. The last one usually identifies the fix by itself.
- Drop probes from access logs, and move SQL text and cache operations to debug.
- Convert the loudest handlers to structured fields, and redact authorisation headers and anything that identifies a person.
- Add a canonical line per request, with request ID, route, status, duration and the business identifiers that matter to that route.
- Sample successful requests at the request level. Keep failures, slow requests and rare routes in full, and write
sample_rateon every line. - Alert on log volume, and put audit events somewhere else entirely.
None of this requires a new vendor. It usually shrinks the bill enough that the vendor conversation becomes easier.
questions people ask
How do I reduce log volume without losing important logs?
Cut noise first: health checks, cache operations and debug lines that are enabled in production. Then sample successful requests, not individual lines, and keep every failed and slow request at full detail. In the worked example those two steps take 72.6 GB a day to 4.75 GB without losing a single failure.
What is a canonical log line?
One wide, structured line written at the end of each request, carrying everything worth knowing about it: route, status, duration, user, timings and business identifiers. Stripe described the pattern in 2019 as a way to make incident queries easy to write, because everything is on one row instead of joined across many.
Should I sample logs in production?
Successful, repetitive requests, yes. Errors, no. Always record the sample rate on the line, because counting sampled lines without weighting them by one over the rate will distort every count you derive from them, including your error rate.
Should health check requests be logged?
Not in your access logs. They run every few seconds forever and tell you nothing your uptime monitor does not. pino-http's autoLogging.ignore option takes a function of the request and response, which is enough to exclude the probe paths.
How much log data does a typical web service generate?
Multiply requests a second by lines per request by bytes per line by 86,400. A service at 200 requests a second writing 12 lines of 350 bytes produces about 72.6 GB a day, or 2,177 GB a month, before any filtering.
What log level should production run at?
Info, with debug available on demand through a runtime switch that reverts itself. Reserve error for things that should wake someone, because a level people learn to ignore is worse than no level at all.
The short version
Log volume is requests times lines times bytes, and most of it is health checks, cache chatter and debug output that nobody reads. Cut that first, because it is free and it makes everything after it cheaper.
Then change the shape rather than the quantity. One canonical line per request, written at the end, with every fact as its own field. Sample successful requests at the request level, keep every failure and every slow request, and record the sample rate so your counts stay honest. In the example here that is 72.6 GB a day down to 3.26 GB, with more answers available than before, not fewer.
The same problem arrives in a new form the moment you add a model to the product, where each call carries a prompt and a completion instead of a message string: tracing every LLM call, token and cost.