Nobody gets paged for a queue that is 4% too slow. Producers write 5,000 messages a second, consumers clear 4,800, every dashboard is green, and the gap quietly adds 720,000 messages an hour. By the time a customer asks why the confirmation for their breakfast order arrived at teatime, the queue is tens of millions deep, and the obvious fix, adding consumers, may not work at all.
Queues are most of how I have kept small teams ahead of growth. At TRIBE, the expensive work moved off the request path into BullMQ and AWS SQS, which is how a small team took the product from nothing to over 100,000 users without a rewrite. At Acefone, Interaction Hub puts voice, WhatsApp messages and WhatsApp Calls in one inbox, with Kafka carrying the events between them. A queue is how you absorb a spike. It is also why, when consumers fall behind, nothing fails loudly. The work just waits.
This post is about the arithmetic of that waiting: how fast a backlog grows, how long it takes to drain, what it means for the person whose message is at the back, and where the ceiling on consumers really is. There is a calculator in the middle for your own numbers.
A small gap becomes a big number
A queue's depth changes every second by production minus consumption. That is all a backlog is. When production is 5,000 a second and consumption is 4,800, the queue gains 200 messages a second, forever, and 200 a second is a much bigger number than it sounds once you multiply it by a day.
| Left alone for | Messages waiting | A new message waits |
|---|---|---|
| 1 hour | 720,000 | 2.5 minutes |
| 1 day | 17,280,000 | 1 hour |
| 1 week | 120,960,000 | 7 hours |
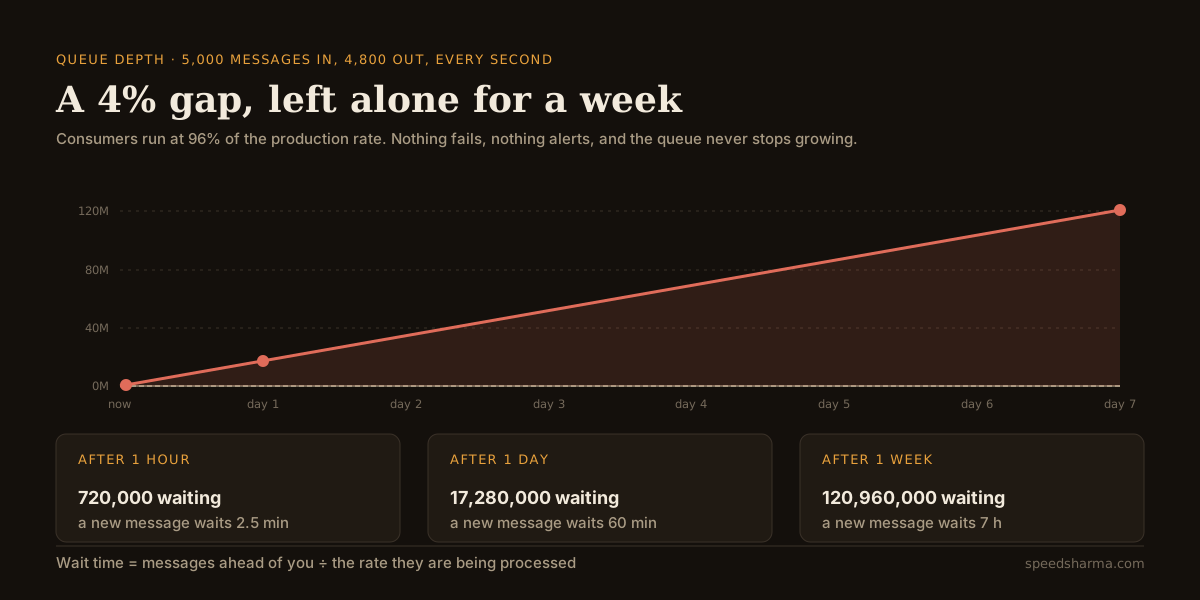
The gap rarely arrives as an incident. It creeps in. Someone adds a call to a downstream API inside the handler. A query gets slower as the table it reads grows. A marketing campaign lifts traffic by a tenth for a fortnight. None of these trips an error alert, because nothing errors. Consumer CPU may even drop, since the consumers spend more of their time waiting on the network.
So the first rule of queues is that you watch the depth and its direction, not just the health of the processes around it. The second rule is that depth in messages is the wrong unit to alert on, which needs a short detour.
Two numbers that matter: drain time and wait time
Three lines of arithmetic cover almost every backlog conversation:
consumption  = working consumers × what one consumer handles a second
drain time   = backlog ÷ (consumption − production)    only if consumption > production
wait now     = backlog ÷ consumption
Drain time answers "when will this be over?". Wait time answers "how stale is the work we are doing right now?", which is what your users experience. They are different numbers, and during an incident you want both on the screen.
The wait-time line comes from Little's law, proved by John Little in 1961: in a stable system, the average number of items inside equals the arrival rate times the average time each one spends there, L = λW. Turn it round and time in the system is items divided by rate. A growing backlog is not a stable system, so for the message joining the back of a first-in, first-out queue right now, the honest version is simpler still: everything ahead of it has to be cleared at the rate consumers work, so it waits backlog ÷ consumption.
This is why a lag alert in raw messages misleads. A lag of 100,000 is twenty seconds of work on a topic that clears 5,000 a second and nearly three hours on one that clears ten. Convert lag to time before you alert on it, and set the threshold from what the business can tolerate: a delivery status can be a minute late, a one-time password cannot.
Take the numbers from the top of the post. Two million messages are waiting, twelve consumers each handle 400 a second, and producers write 5,000. Consumption is 4,800, so a new message waits 2,000,000 ÷ 4,800, about seven minutes, and the backlog never drains. Add two consumers and consumption is 5,600, which is 600 above production. The same two million now clear in 2,000,000 ÷ 600, about 56 minutes. Two extra pods turn "never" into "within the hour". Notice how non-linear that is: the first 200 messages a second of extra capacity only stop the growth, and only the capacity above that does any draining.
Spare capacity is your recovery time
Teams size consumers for steady state: enough to keep up with normal traffic, plus a little. The case that hurts is recovery. A deploy breaks the consumer for an hour. A downstream API starts rate-limiting you. The database fails over and connections take a while to come back. Throughout all of it, producers keep writing.
After a stall of one hour, the backlog is one hour of traffic. The only thing that can drain it is the capacity you have above the incoming rate, while that traffic keeps arriving. So the drain time is the length of the stall divided by your spare capacity as a fraction of production.
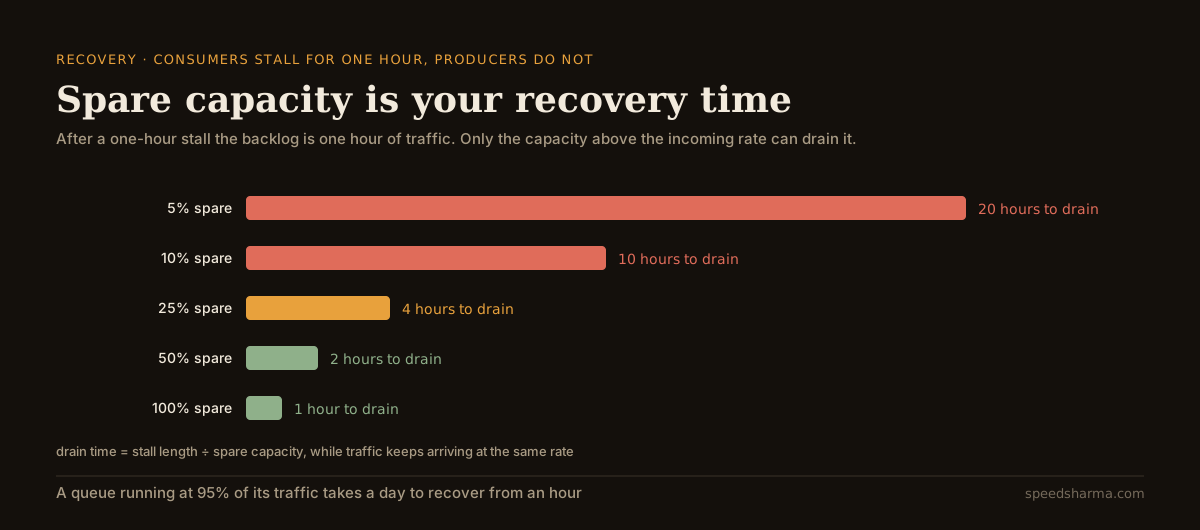
That turns a vague capacity question into a decision someone can make. "After an hour-long outage, how long are we willing to run late?" If the answer is two hours, you need 50% more consumer capacity than your normal traffic uses, available on demand. Autoscaling can provide it, but only if the extra consumers can actually do work, which brings us to the two things that stop them: partitions, and whatever the consumers all talk to.
The second one is easy to forget. If every consumer writes to the same Postgres database, and that database is already the slow part, doubling the consumers doubles the load on the database rather than the throughput. Measure what one consumer handles with the others running, not in isolation.
The partition ceiling
Kafka's consumer model is the reason "just add consumers" sometimes does nothing. In a consumer group, each partition is assigned to exactly one consumer. That is how Kafka keeps messages in order within a partition. It also means the most consumers that can do work at once is the number of partitions. Start more and the extras join the group, receive nothing, and sit idle.
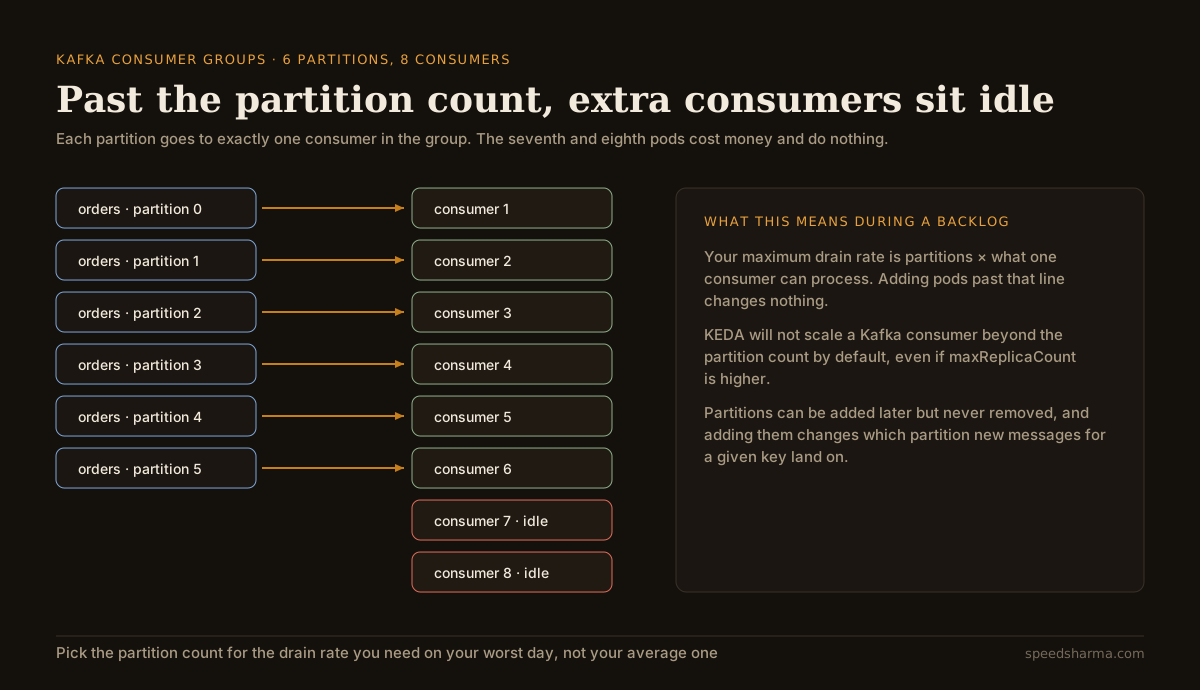
Autoscalers know this. The KEDA Kafka scaler says that by default the number of replicas will not exceed the number of partitions on the topic, and that if maxReplicaCount is set higher, the scaler will not scale up to it. You can override that with allowIdleConsumers, but the extra replicas will still have nothing to read.
You can add partitions, with kafka-topics.sh --alter --partitions, but the Kafka operations guide is blunt about the other direction: "Kafka does not currently support reducing the number of partitions for a topic." It also warns that adding partitions "doesn't change the partitioning of existing data", so new messages for a given key can land on a different partition from the old ones. If anything downstream relies on per-key ordering, that matters.
It also means adding partitions during an incident does not help with the backlog you already have. Those messages sit in the old partitions, and each old partition can still only be read by one consumer. The partition count is a decision you make for your worst day, in advance.
Here is what that looks like in numbers. Say a weekend outage leaves 50 million messages in a topic with 24 partitions, each consumer handles 400 a second, and production is still 5,000. At the cap, 24 consumers clear 9,600 a second, 4,600 above production, and the backlog takes 50,000,000 ÷ 4,600 seconds, just over three hours. Draining it within one hour would need 48 consumers: twice the partitions you have. No amount of Kubernetes will close that gap on the day.
RabbitMQ and SQS work differently. Consumers compete for messages on a single queue, so there is no partition count holding you back, but the order of processing is no longer guaranteed once several consumers share a queue, and the ceiling moves to whatever the consumers depend on.
| during a backlog | Kafka consumer group | RabbitMQ queue |
|---|---|---|
| Most consumers that can work | one per partition | no fixed cap; consumers compete for messages |
| What KEDA scales on | consumer lag against lagThreshold | queue length or message rate, via mode and value |
| Ordering | kept within each partition | not guaranteed once consumers share a queue |
| Throwing away stale work | retention, compaction, or resetting the group's offsets | queue or message TTL, with dead-lettering |
| Replaying later | re-read anything still retained | once acknowledged, a message is gone |
Work out your own drain
Put in your own numbers. The defaults are the example above: two million behind, 5,000 a second arriving, twelve consumers at 400 a second each, 24 partitions and a one-hour target. Then try a backlog of 50,000,000 to watch the partition cap take over.
calculator · queue backlog, drain time and consumers needed
Will this backlog ever drain?
queue depth from now
Assumes steady rates: production stays where it is and every consumer keeps its measured throughput. Real drains are usually slower, because consumers hammer the same database and a rebalance pauses a Kafka group while pods join. The wait is for a message joining the back of a first-in, first-out queue now.
A note on the "one consumer handles" field: measure it from production during a busy hour, dividing messages processed by consumer count, rather than taking it from a benchmark. The benchmark did not have the other consumers competing for the same database.
quick check
A topic has 24 partitions. Each consumer handles 400 messages a second and producers write 5,000 a second. There are 50 million messages waiting. You scale the consumer deployment from 12 pods to 48. How long until the backlog is gone?
Kafka gives each partition to one consumer, so 24 of the 48 pods sit idle. The 24 that work clear 9,600 a second, 4,600 more than arrives, and 50,000,000 ÷ 4,600 is about 10,900 seconds.
Scale consumers on lag, not CPU
The default Kubernetes autoscaler watches CPU, and a consumer stuck waiting on a slow downstream call shows low CPU while its backlog climbs. Scale on the thing you care about. KEDA reads consumer lag directly and drives the replica count from it:
apiVersion: keda.sh/v1alpha1
kind: ScaledObject
metadata:
  name: order-consumer
spec:
  scaleTargetRef:
    name: order-consumer
  minReplicaCount: 2
  maxReplicaCount: 24          # the partition count; more would sit idle
  triggers:
    - type: kafka
      metadata:
        bootstrapServers: kafka:9092
        consumerGroup: order-processor
        topic: orders
        lagThreshold: "1000"
        offsetResetPolicy: latest
KEDA's documentation describes lagThreshold as the target for total lag across partitions, and its own worked example, with a threshold of 10, runs one consumer for a lag of up to 10 and two for a lag of 11 to 20. In practice that is roughly one replica per threshold's worth of lag, stopping at the partition count. Pick the threshold in time, not messages: at 400 a second, a threshold of 1,000 is two and a half seconds of work per consumer.
For RabbitMQ, the KEDA RabbitMQ scaler takes a mode and a value, and the value is per replica: with QueueLength and a value of 20, a queue of 60 messages runs three pods. The older queueLength field is deprecated.
triggers:
  - type: rabbitmq
    metadata:
      queueName: order-processing
      mode: QueueLength
      value: "500"
    authenticationRef:
      name: rabbitmq-connection
One practical warning: if KEDA owns the deployment, a manual kubectl scale during an incident gets undone by the autoscaler. Raise minReplicaCount instead.
Make each consumer faster
When you are at the partition cap, the only remaining lever is what each consumer can do. A consumer that awaits one message at a time spends most of its life waiting on the network. If the work does not need strict ordering, process a batch concurrently:
import pLimit from 'p-limit'

const consumer = kafka.consumer({ groupId: 'order-processor' })
const limit = pLimit(10)

await consumer.run({
  partitionsConsumedConcurrently: 3,
  eachBatchAutoResolve: false,
  eachBatch: async ({ batch, resolveOffset, heartbeat }) => {
    await Promise.all(
      batch.messages.map((message) =>
        limit(() => processOrder(JSON.parse(message.value!.toString())))
      )
    )
    for (const message of batch.messages) resolveOffset(message.offset)
    await heartbeat()
  },
})
Three things to know about that snippet. First, it gives up ordering within a partition, which is fine for independent orders and wrong for a stream of updates to the same account. Second, KafkaJS keeps messages from one partition in order across partitionsConsumedConcurrently, and advises not setting it higher than the number of partitions you consume. Third, if one message in the batch fails, none of the offsets are resolved and the whole batch comes back, so every message in it will be processed at least twice. That only works if processing is idempotent.
Batches have their own trap. In the Java client, if processing a batch takes longer than max.poll.interval.ms, five minutes by default, the consumer proactively leaves the group and its partitions are handed to someone else. During a backlog, when batches are full and downstream systems are slow, that can turn into a loop of rebalances where nobody makes progress. Keep batches small enough to finish well inside the limit; max.poll.records defaults to 500.
On RabbitMQ, the equivalent control is the prefetch count, which limits the number of unacknowledged messages a consumer holds at once. The other fix worth making in most RabbitMQ consumers is what happens on failure:
await channel.prefetch(50)

await channel.consume('orders', async (msg) => {
  if (!msg) return
  try {
    await processOrder(JSON.parse(msg.content.toString()))
    channel.ack(msg)
  } catch {
    channel.nack(msg, false, false) // to the dead-letter exchange, not back on the queue
  }
})
A message that fails every time and is put back on the queue with requeue set to true will fail forever, at full speed, taking a consumer's attention with it. Rejecting it with requeue false dead-letters it when the queue has a dead-letter exchange configured, so a person can look at it later and the backlog keeps moving.
Decide what not to process
Sometimes the fastest way to drain a queue is to admit that some of it is worthless. A price update from two hours ago has been replaced a thousand times since. A "user is typing" event from last night helps nobody. Deciding this ahead of time is much calmer than deciding it at 3 a.m.
- Expire it. RabbitMQ's
x-message-ttlsets how long a message may live in a queue, in milliseconds, and expired messages can be routed to a dead-letter exchange. One catch from the TTL documentation: in classic queues, expired messages are only discarded when they reach the head of the queue, so they still count towards the depth until then. - Keep only the latest per key. For data where only the current value matters, such as stock levels or a user's profile, a Kafka topic with
cleanup.policy=compactkeeps the latest message for each key, and a consumer catching up reads far fewer messages. - Skip it in the consumer. Check the age of each message and drop the ones past their use, counting them so you know how many:
const MAX_AGE_MS = 10 * 60_000

async function handle(message: KafkaMessage) {
  if (Date.now() - Number(message.timestamp) > MAX_AGE_MS) {
    metrics.increment('orders.skipped_stale')
    return
  }
  await processOrder(JSON.parse(message.value!.toString()))
}- Separate what matters most. RabbitMQ supports priority queues, but its documentation recommends only a handful of levels and warns that a high prefetch undermines them, because messages already delivered to a consumer are not reordered. A separate queue for the urgent work, with its own consumers, is usually clearer. Priority has to come from the kind of message, such as payments ahead of analytics. Setting it from message age at publish time does nothing, because every message is new when it is published.
Shedding work belongs next to backpressure: the consumer should be able to slow producers down or refuse work, rather than accepting everything and falling behind silently.
Alert before it is a backlog
Measure lag per partition and convert it to time. With KafkaJS's admin client, lag is the latest offset minus the group's committed offset, summed across partitions:
async function orderLag(admin: Admin) {
  const [latest, [committed]] = await Promise.all([
    admin.fetchTopicOffsets('orders'),
    admin.fetchOffsets({ groupId: 'order-processor', topics: ['orders'] }),
  ])
  return latest.reduce((sum, p) => {
    const done = committed.partitions.find((c) => c.partition === p.partition)
    return sum + Math.max(0, Number(p.offset) - Math.max(0, Number(done?.offset ?? 0)))
  }, 0)
}
Divide that by your measured consumption rate and alert on the result. Three alerts cover most of it: the wait is longer than the business can tolerate; lag has grown for fifteen minutes in a row, which catches the slow 4% gap long before it is big; and a queue has messages but no consumers at all, which RabbitMQ's management API reports directly. Keep the alert text specific enough that whoever is on call knows what to do, a theme covered in logging everything and learning nothing.
A recovery playbook
When it has already happened:
# 1. How far behind, per partition. One partition far ahead of the rest is a hot key,
#    and more consumers will not fix it.
kafka-consumer-groups.sh --bootstrap-server kafka:9092 \
  --describe --group order-processor

# 2. Scale to the partition count, not past it.
kubectl scale deployment order-consumer --replicas=24

# 3. Only if old messages are worthless: stop the consumers, preview, then skip ahead.
kafka-consumer-groups.sh --bootstrap-server kafka:9092 \
  --group order-processor --topic orders \
  --reset-offsets --to-datetime 2026-03-13T00:00:00.000 --dry-run
Rerun the last command with --execute once the preview looks right. The tool's own help text says the group's instances should be inactive during a reset and that --dry-run is the default, and the datetime format is YYYY-MM-DDThh:mm:ss.sss.
In between those steps, turn off optional side effects. A drain mode that skips analytics events and non-critical emails can buy back a surprising share of each consumer's time. Afterwards, write down the two numbers from this post: how much spare capacity you run with, and what the partition count caps you at. They decide how the next one goes.
questions people ask
How long will my Kafka consumer lag take to clear?
Divide the lag by consumption minus production, where consumption is working consumers times what each handles a second. If consumption is not above production, it never clears, however long you wait.
Can I run more Kafka consumers than partitions?
You can start them, but each partition goes to exactly one consumer in the group, so the extras sit idle. KEDA will not scale a Kafka consumer beyond the partition count unless you set allowIdleConsumers.
What is a good consumer lag alert threshold?
Set it in time, not messages. Divide lag by your consumption rate and alert when the wait passes what the business tolerates, plus a second alert when lag has grown steadily for fifteen minutes or so.
Does adding partitions fix a Kafka backlog?
Not the one you already have. Existing messages stay in their old partitions, and each is still read by one consumer. More partitions raise the ceiling for next time, and Kafka cannot reduce them later.
How do I autoscale Kafka or RabbitMQ consumers on Kubernetes?
KEDA scales a deployment on consumer lag for Kafka, using lagThreshold, or on queue length or message rate for RabbitMQ, using mode and value. Cap Kafka consumers at the partition count.
The short version
A backlog shrinks only by the capacity you have above the incoming rate. If consumption is below production, it never drains; if it is only just above, it drains so slowly that any stall turns into hours of lateness. Watch the wait time, which is the backlog divided by consumption, rather than the raw message count.
Before the bad day, check two numbers. Your spare capacity decides how long recovery takes, and in Kafka your partition count caps how many consumers can help. When you hit that cap, make each consumer faster, and decide in advance which messages are safe to expire, compact or skip.