Every dashboard says the service is fine. The p99 is 40 ms, the error rate is flat, and the on-call engineer has nothing to do. Meanwhile support is collecting complaints about a screen that "sometimes takes forever".
Both are true. The p99 on that dashboard describes one backend call. The screen the customer is waiting on made forty of them. Those are different questions with very different answers, and the gap between them is arithmetic you can do on a napkin.
At Acefone I work on the Interaction Hub, where one agent screen pulls together voice, WhatsApp and call state from several services at once. Anything that fans out like that inherits this problem: the user does not experience the median call, or even the p99 call. They experience the slowest one.
The formula, and why it is so unforgiving
If a request needs all n backends to answer, and each is independently slow with probability p, then the chance every one of them is fast is (1 − p)ⁿ, so the chance at least one is slow is
P(at least one slow) = 1 − (1 − p)^nThe reason this surprises people is that it grows quickly while p stays reassuringly small. Jeffrey Dean and Luiz André Barroso set it out in The Tail at Scale, the 2013 Communications of the ACM paper that named the problem: "consider a system where each server typically responds in 10ms but with a 99th-percentile latency of one second. If a user request is handled on just one such server, one user request in 100 will be slow (one second). ... If a user request must collect responses from 100 such servers in parallel, then 63% of user requests will take more than one second."
Put 1 − 0.99¹⁰⁰ into a calculator and you get 0.634. Their second example is the one that should worry anyone running a large system: "Even for services with only one in 10,000 requests experiencing more than one-second latencies at the single-server level, a service with 2,000 such servers will see almost one in five user requests taking more than one second." That is 1 − 0.9999²⁰⁰⁰ = 0.181.
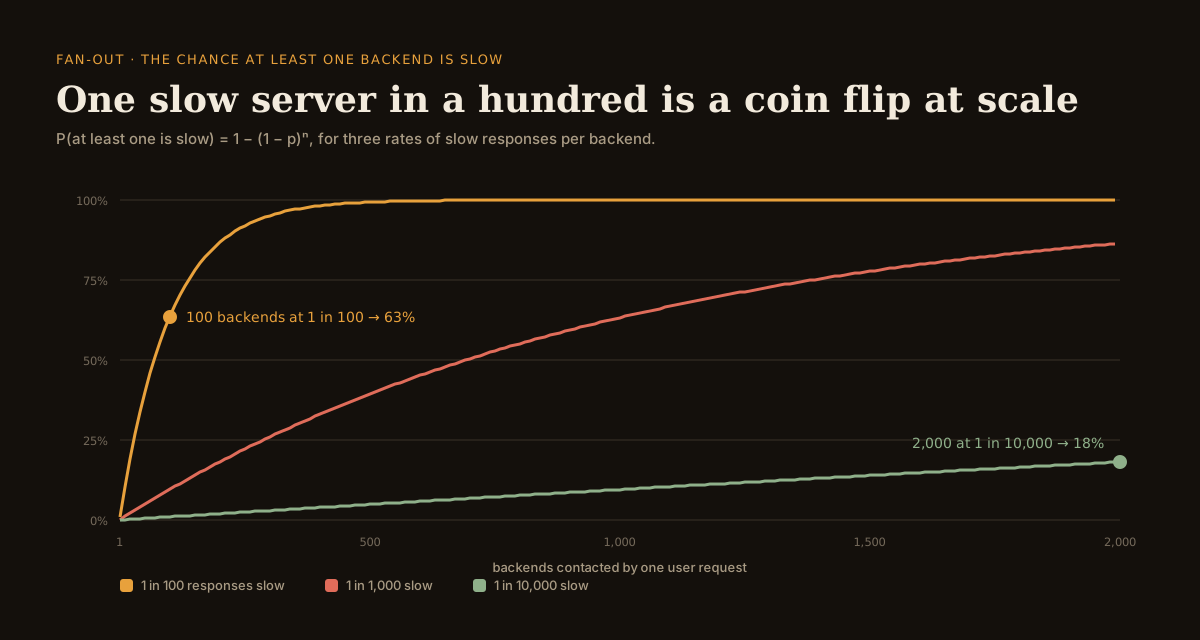
Notice how little fan-out it takes. At ten backends the same 1% slow rate already makes about one user request in ten slow. You do not need a warehouse of servers to meet this problem; you need a page that loads a profile, a feed, a notification count, a feature flag and a price.
The percentile you actually have to hit
Turn the formula around and it gives you a target. If you want 99% of user requests to stay under some latency, and each request touches n backends, then each backend must stay under that latency with probability (0.99)^(1/n), so its slow rate must be
p = 1 − 0.99^(1/n)| Backends per request | Slow rate each backend may have | Roughly |
|---|---|---|
| 1 | 1 in 100 | p99 |
| 10 | 1 in 995 | p99.9 |
| 25 | 1 in 2,488 | p99.96 |
| 100 | 1 in 9,950 | p99.99 |
| 500 | 1 in 49,750 | p99.998 |
| 1,000 | 1 in 99,500 | p99.999 |
This table is the reason "our p99 is good" is not a useful statement on its own. A team with a 100-way fan-out that is proud of its p99 is describing a service that makes two thirds of user requests slow. The number that matters to them lives two nines further out, where most teams have no measurements at all because a p99.99 needs ten thousand samples per bucket before it means anything.
What the fan-out is really waiting for
There is a second effect underneath the first one, and the paper measured it on a live Google service.
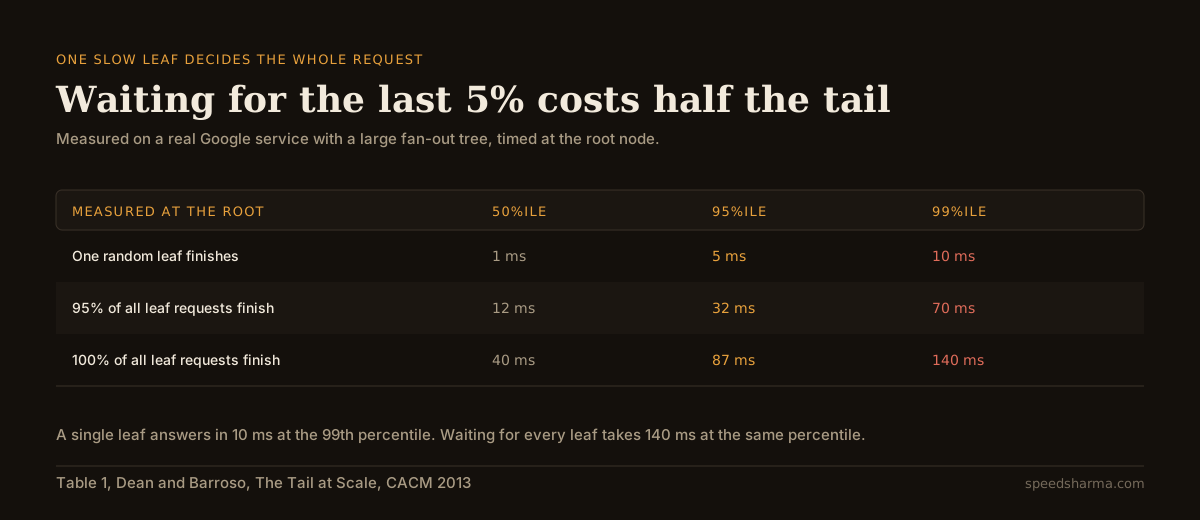
In their words: "The 99th-percentile latency for a single random request to finish, measured at the root, is 10ms. However, the 99th-percentile latency for all requests to finish is 140ms, and the 99th-percentile latency for 95% of the requests finishing is 70ms, meaning that waiting for the slowest 5% of the requests to complete is responsible for half of the total 99%-percentile latency."
Half the tail comes from the last twenty-first of the work. That is the single most useful fact in this post, because it tells you where to spend effort: not on making the median faster, but on not waiting for the stragglers.
Work out your own fan-out
Count the backend calls one user action makes, including the ones inside your own service, and put in the rate at which each one goes slow.
calculator · 1 − (1 − p)ⁿ
What fan-out does to your tail latency
share of user requests that wait for a slow backend, by fan-out
the same fan-out, with a hedged request on the slowest calls
The formula assumes backends are slow independently of one another, which is the optimistic case: in practice they share networks, storage and noisy neighbours, so slowness arrives in correlated bursts. Hedging is modelled as a second copy of the slowest calls, which is slow only if both copies are slow, and it costs roughly the share of requests past your chosen percentile. Hedge only work that is safe to run twice.
Counting is harder than it sounds, and people usually undercount. A single page in a modern app touches auth, the primary record, a couple of joins that became services, a feature flag provider, an analytics beacon that someone made blocking, and a CDN miss. If you have distributed tracing, the fan-out is already in your traces; if you have structured logs with a request id, you can count them from a single trace by hand in ten minutes.
quick check
Each backend answers within 200 ms for 99% of calls. One user request waits on 50 of them in parallel. What share of user requests takes longer than 200 ms?
1 − 0.99⁵⁰ = 0.395, so nearly two requests in five wait for a slow backend. The 63% figure is the answer for 100 backends. Each backend's own dashboard still shows a healthy 99%.
Hedging: a second copy of the slowest calls
The fix that does the most, for the least architectural upheaval, is to stop waiting on a straggler you have already waited too long for.
A hedged request means sending the same request to a second replica after a delay, then taking whichever answer comes back first. The delay is the trick: send the hedge immediately and you double your traffic; send it only after the request has taken longer than, say, the 95th percentile, and you add about 5% more calls, because by definition only 5% of calls are that slow.
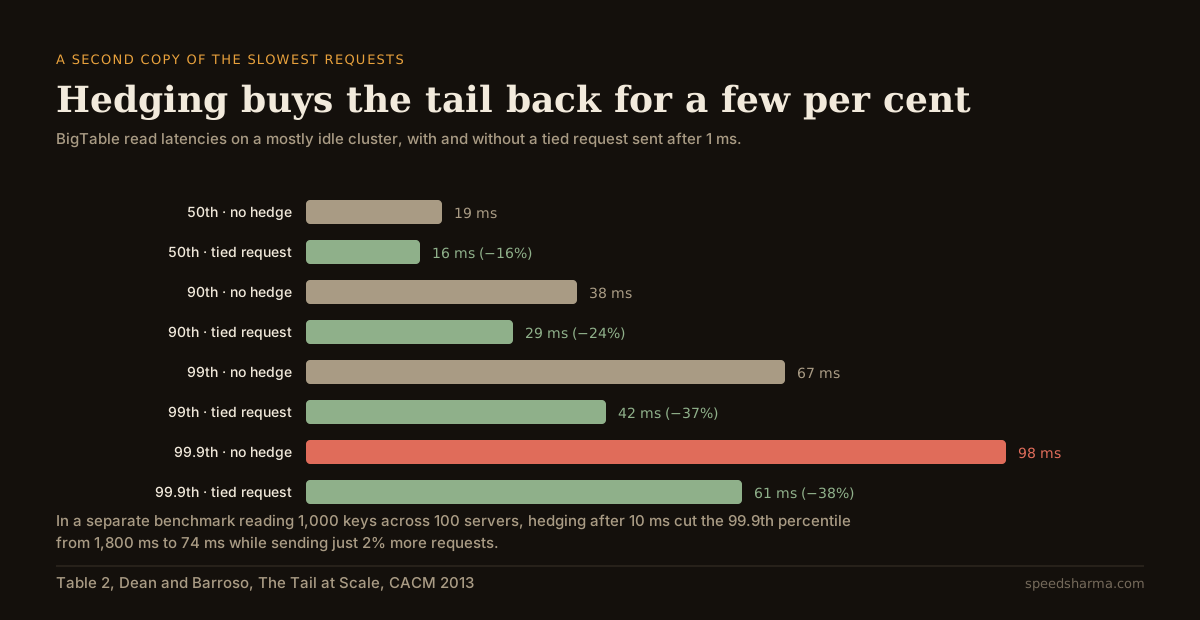
The headline number from the paper is worth quoting in full: "in a Google benchmark that reads the values for 1,000 keys stored in a BigTable table distributed across 100 different servers, sending a hedging request after a 10ms delay reduces the 99.9th-percentile latency for retrieving all 1,000 values from 1,800ms to 74ms while sending just 2% more requests."
From 1.8 seconds to 74 milliseconds, for 2% more load. There are not many trades like that in this job.
Tied requests are the refinement. Instead of waiting, the client sends the request to two servers at once, each "tagged with the identity of the other server", and whichever server starts work first sends a cancellation to its twin. The paper reports the overhead of tied requests in disk utilisation as "less than 1%", with the reductions shown in the figure above.
You do not have to build this yourself. gRPC's client retries design specifies a hedging policy with maxAttempts, hedgingDelay and nonFatalStatusCodes, where "hedging can be seen as retrying the original RPC before a failure is even received", and "when a non-error response is received (in response to any of the hedged requests), all outstanding hedged requests are canceled".
The other four levers
Hedging treats the symptom. These reduce the exposure:
- Cut n. The cheapest fan-out fix is the call you do not make. Batch the ten calls into one, cache the feature flags in the process, and denormalise the field you are joining a service to fetch. Halving the fan-out roughly halves the slow share while p stays put.
- Stop waiting for the optional. Google's search systems return "good-enough" results when a sufficient fraction of leaves has answered, and skip subsystems such as ads or spelling correction "for Web searches if they do not respond in time". Most products have at least one panel that could render without blocking the page.
- Make the slow path cheap to abandon. Timeouts per backend, not just for the whole request, so one straggler cannot consume the entire budget. This is the same discipline as a latency budget for a voice agent, where every stage gets a number and the sum is the promise.
- Attack the causes of variability. The paper lists the usual suspects: shared resources, background daemons, maintenance jobs such as log compaction and garbage collection, queueing in intermediate servers, power limits and energy management. A batch job that runs at the top of the hour is a tail-latency feature request.
Measure the thing the user waits for
Marc Brooker makes the architectural version of this point in Tail Latency Might Matter More Than You Think: "one user interaction can translate into many, many, service calls." The practical consequence is about instrumentation rather than maths.
- Measure end to end. Instrument the user-visible operation, not only the individual services. If the only percentiles you have are per-service, you are measuring the thing that looks healthy.
- Push your percentiles out. For a service behind a large fan-out, p99 is a vanity metric. Chart p99.9 and p99.99 and be honest about how few samples sit behind them.
- Watch the slowest dependency, not the average one. Your observability should be able to answer "which backend was the straggler" for a single slow request, which means trace ids on every hop.
- Remember the formula flatters you. Slowness is correlated: a garbage collection pause, a hot shard or a saturated network link makes several backends slow at once. Independence is the optimistic assumption, so treat every number here as a floor.
questions people ask
What is tail latency amplification?
When one user request depends on many backend calls, the chance it meets a slow one grows with the number of calls: 1 − (1 − p)ⁿ. A backend that is slow 1% of the time makes 63% of user requests slow at a fan-out of 100.
Why is my p99 healthy while users complain about slowness?
Because your p99 describes a single backend call and the user is waiting for all of them. With a fan-out of 50 and a per-backend p99, roughly 39% of user requests wait on a slow call, and none of your service dashboards will show it.
What percentile do my backends need for a user-facing p99?
Roughly 1 − 0.99^(1/n). For 10 backends that is about p99.9, for 100 it is about p99.99, and for 1,000 it is about p99.999.
What are hedged requests?
A second copy of a request, sent to another replica after a delay, with the first answer winning. Deferring the hedge until the 95th percentile keeps the extra load near 5% while cutting the tail sharply.
What is the difference between hedged and tied requests?
A hedged request is sent after a delay. A tied request is sent to two servers at once, each tagged with the other's identity, and whichever starts first cancels its twin. Tied requests remove the delay at the cost of a brief window where both may start.
Do hedged requests double the load on my service?
Not if you defer them. Hedging only the calls that pass a high percentile means only that share is duplicated: about 5% when hedging at p95, and 2% in the benchmark published in The Tail at Scale.
The short version
A user request that waits on n backends is slow whenever any one of them is slow, so the chance of a slow request is 1 − (1 − p)ⁿ. At a hundred backends, a 1% slow rate produces 63% slow requests. The per-service dashboards will all look fine while this happens.
So size your percentile targets against your fan-out rather than against habit, count the calls one user action really makes, and stop waiting for stragglers: hedge the slowest few per cent, time out per dependency, batch what you can and render without the optional panels. Then measure the operation the user is actually waiting for, because that is the only percentile they experience.