The first time most teams think about connection pools is when Postgres starts answering with FATAL: sorry, too many clients already. The second time is when somebody notices the database is at 100% CPU while doing less work than it did last month.
Both have the same root: the pool size was never chosen. It came from a library default, got multiplied by however many app instances the autoscaler felt like running, and landed somewhere between "wasteful" and "refuses connections". The fix is arithmetic and one counterintuitive idea, which is that a smaller pool is usually faster.
EMPRO, which I built and ran on my own at 99.9% uptime, was deliberately boring in this respect: one service, one database, one pool, and a number I could keep in my head. That is the easy case. The moment you have a dozen instances, a queue worker fleet and a migration job, the sum stops being obvious and starts being a production incident.
The multiplication nobody does
A pool is per process. Every instance of your app opens its own, so the number the database experiences is the product, not the setting in your config file.
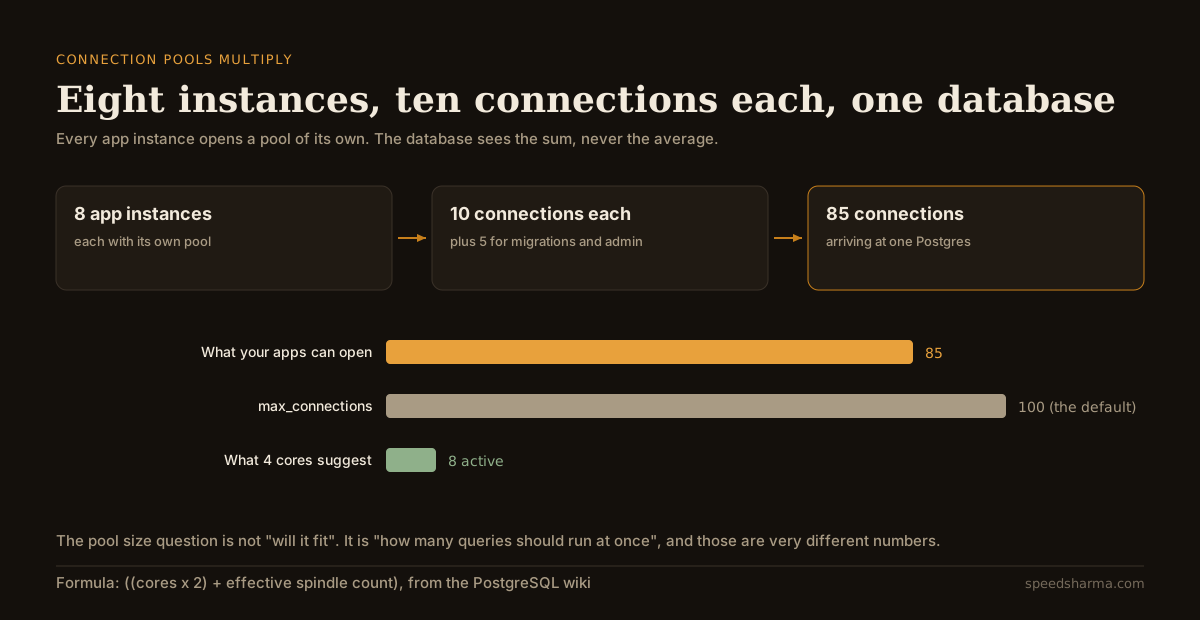
Eight instances with the common default pool of ten, plus five connections for migrations, cron and the admin tool somebody left connected, is 85 connections against a default limit of 100. That works until the autoscaler adds two more instances, at which point the arithmetic says 105 and Postgres says no.
The multiplication gets worse in three familiar situations. Serverless functions each hold their own pool, so concurrency and connection count become the same number. Queue workers are usually a second fleet with a second pool that nobody counted. And splitting a service into several services too early multiplies pools by the number of services, all pointed at the same database.
max_connections is a limit, not a target
max_connections is the cap on concurrent connections to the server. The PostgreSQL documentation is worth reading closely: "The default is typically 100 connections, but might be less if your kernel settings will not support it," and "This parameter can only be set at server start."
Two consequences follow. The first is operational: changing it is a restart, which means the middle of an incident is the worst time to discover you need a bigger number. The second is more important, and the docs say it plainly: "PostgreSQL sizes certain resources based directly on the value of max_connections. Increasing its value leads to higher allocation of those resources, including shared memory."
So raising the limit is not free, and it does not make the database able to do more work. It makes it able to accept more clients who will then compete for the same cores and the same locks. If you run a standby, note that it "must set this parameter to the same or higher value than on the primary server".
How many connections can a database actually use?
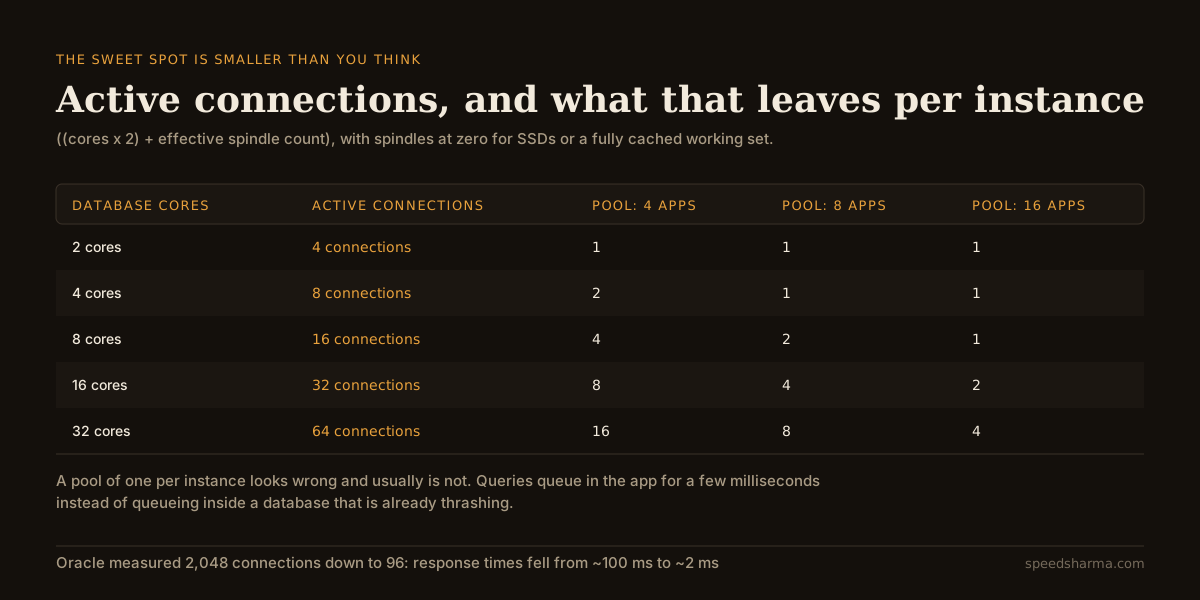
This is the number that matters, and it is much smaller than people expect. The PostgreSQL wiki gives the starting point: "the number of active connections should be somewhere near ((core_count * 2) + effective_spindle_count)". Core count means real cores, not hyperthreads, and the effective spindle count is zero when the working set is cached in RAM or living on SSDs.
The same page is careful about what it is counting: "this 'sweet spot' is for the number of connections that are actively doing work". Idle connections in a pool are not free, but they are not what the formula is about.
Why does more hurt? The wiki lists the mechanisms: lock contention, where "as more processes compete for the spinlocks they account for a high percentage of CPU time"; context switching, where "while the core is busy swapping states it is not doing any useful work"; and cache effects as each additional backend evicts another's data.
HikariCP's About Pool Sizing page puts the design goal in one sentence: "You want a small pool, saturated with threads waiting for connections." It also cites the Oracle Real-World Performance demonstration where reducing the pool alone, from 2,048 connections to 96, "decreased the response times of the application from ~100ms to ~2ms -- over 50x improvement".
The same page notes that faster storage argues for fewer connections, not more: "Faster, no seeks, no rotational delays means less blocking and therefore fewer threads [closer to core count] will perform better than more threads." If you moved to SSDs and raised your pool, you tuned in the wrong direction.
Work out your own budget
Put in the instance count at peak, including the queue workers, and the pool size each one is configured with.
calculator · connection budget
Will your pools fit in max_connections?
connections, three ways of counting
total connections as you add instances, at this pool size
The limit check counts connections your app tier can open at once, which is what a restart or a traffic spike will actually try to do. The sweet-spot figure is the PostgreSQL wiki's starting point for connections that are actively running queries; pooled idle connections are cheaper than that but still hold server memory. Neither number replaces measuring your own workload.
The two numbers to watch are the share of max_connections you can reach on a bad day, and the gap between what your tier can open and what the database can usefully run at once.
quick check
Twelve app instances each keep a pool of 20 connections, and migrations and admin tools account for another 5. What does a database with the default max_connections see?
12 × 20 + 5 = 245. Each instance holds its own pool, so the database faces the sum, which is nearly two and a half times the default limit of 100. The limit does not cap what your apps try to open; it decides which attempts fail.
When you need pgbouncer
If the app tier genuinely needs to scale past what the database should run at once — and at a few dozen instances it will — put a pooler in front.
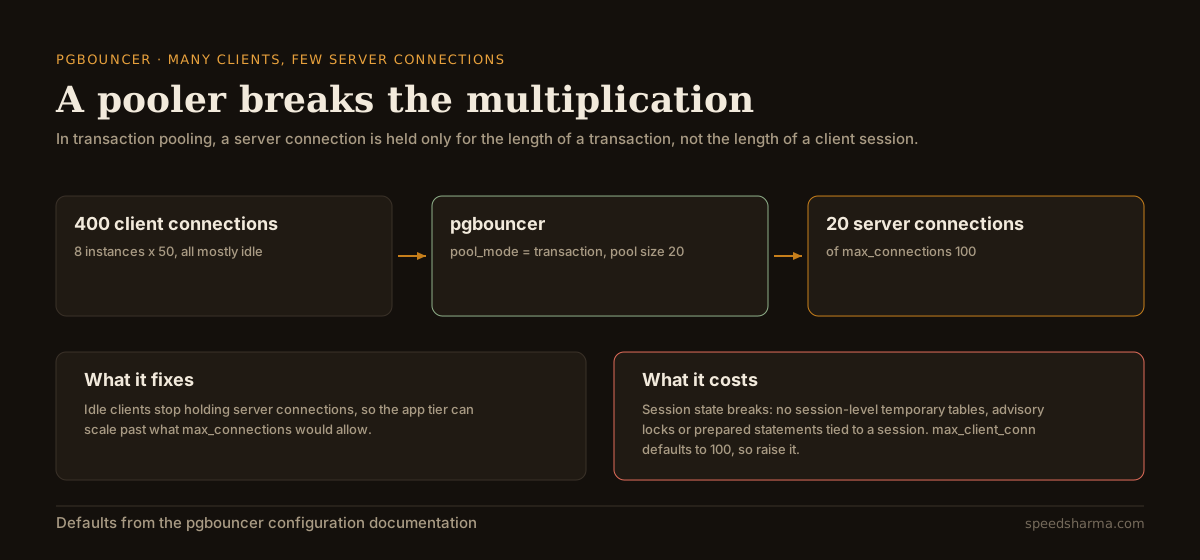
The pgbouncer configuration defines three modes, and the middle one is the reason it exists:
| What changes | Session pooling (default) | Transaction pooling |
|---|---|---|
| "Server is released back to pool after client disconnects" | "Server is released back to pool after transaction finishes" | |
| One server connection per connected client, so the multiplication survives | One server connection per in-flight transaction, so idle clients cost nothing | |
Session state is safe: temporary tables, advisory locks, SET | Session state is not safe, because each transaction may land on a different server connection | |
| Useful as a connection cache and for failover | The mode that lets hundreds of clients share tens of connections |
The documentation is explicit about the trade: "clients must not use any session-based features, since each transaction ends up in a different connection and thus gets a different session state". Prepared statements tied to a session, advisory locks held across statements, SET for the rest of the connection, session-level temporary tables: all of that changes meaning.
The defaults are conservative and catch people out:
| Setting | Default | What it does |
|---|---|---|
pool_mode | session | Session pooling unless you change it, which keeps the multiplication |
default_pool_size | 20 | Server connections per user and database pair |
max_client_conn | 100 | Total client connections pgbouncer will accept |
min_pool_size | 0 | No warm connections kept ready |
reserve_pool_size | 0 | No overflow for bursts |
The one that surprises everyone is max_client_conn at 100. Installing pgbouncer to escape a 100-connection limit, and leaving that default, gets you a 100-connection limit one hop earlier.
What I would actually set
- Start from the database, not the app. Work out ((cores × 2) + spindles), then divide by the number of instances you run at peak. If that gives a pool of one or two per instance, believe it and measure before you raise it.
- Count every client. Web instances, queue workers, cron jobs, migrations, the BI tool, your own psql session. Migrations are the classic: they run at deploy time, which is exactly when instance count is briefly doubled.
- Cap the damage with timeouts. A connection acquisition timeout in the app, plus
statement_timeoutandidle_in_transaction_session_timeouton the database, so one stuck transaction cannot hold a pool slot forever. - Give background work its own pool, and make it smaller. A worker fleet that shares the web tier's budget will starve user requests during a backlog. That failure mode is the same one as a queue with no backpressure: the work arrives faster than the resource allows, and something has to give way deliberately.
- Measure the wait, not the pool. Every decent pool library exposes time spent waiting for a connection and the number of threads waiting. If the wait is milliseconds, the pool is fine no matter how small it looks.
- Reach for pgbouncer when instance count, not query volume, is the problem. It fixes idle clients holding connections. It does not make queries faster.
questions people ask
What is a good Postgres connection pool size?
Start from ((cores × 2) + effective spindle count) for connections actively running queries, then divide by the number of app instances. A four-core database behind eight instances lands near one connection per instance, which is smaller than most defaults.
What is the default max_connections in Postgres?
Typically 100, though it can be lower if kernel settings do not support it. It can only be changed at server start, and Postgres sizes shared memory and other resources from its value.
Should I increase max_connections?
Rarely as a first move. It does not add capacity; it allows more clients to compete for the same cores and locks, and it raises resource allocation. Reducing pool sizes or adding a pooler usually fixes the problem better.
Why is a smaller connection pool faster?
Because beyond roughly twice the core count, extra connections add context switching, spinlock contention and cache pressure rather than throughput. Oracle's Real-World Performance group measured a drop from about 100 ms to about 2 ms by cutting a pool from 2,048 to 96.
When do I need pgbouncer?
When the number of app instances, not the amount of query work, is what pushes you past max_connections. In transaction mode it holds many idle clients in front of a few server connections.
What breaks with pgbouncer transaction pooling?
Anything that assumes a connection is a session: session-level temporary tables, advisory locks held across statements, SET outside a transaction, and prepared statements tied to a session. Each transaction may land on a different server connection.
The short version
Connection pools multiply by instances, so the number your database sees is instances × pool plus everything else that connects. Compare that with max_connections, which defaults to 100 and needs a restart to change, and then compare it with the much smaller number of connections your database can actually keep busy: roughly twice the core count.
Most teams are three or four times over that second number and think their problem is the first one. Shrink the pool until the wait time in the app becomes visible, put timeouts everywhere, give background work its own small budget, and add pgbouncer in transaction mode when instance count is what you are really fighting.