Every system that passes work from one place to another has two rates: how fast the work arrives, and how fast it is finished. When the first is larger than the second, the difference has to go somewhere. If you have not decided where, the answer is your heap, and the deadline is whenever it fills.
This is the least dramatic outage in engineering. Nothing is broken. The code is correct, the database is healthy, the third party is up. The process simply accumulates until the kernel or the runtime kills it, and every event it was holding disappears with it.
I have spent most of my career on the arriving side of that pipe: live market data over Socket.io and Redis pub/sub at TRIBE, where the price feed does not slow down because your consumer is having a bad minute, and voice and WhatsApp events at Acefone, where the carrier will keep delivering whatever happens next.
The arithmetic of a queue with no ceiling
Here is the shape of the code that causes it. It looks harmless in review, and it is in almost every codebase I have been asked to look at.
const queued: Event[] = [];

source.on('data', (event: Event) => {
  queued.push(event); // 2,000 a second, whatever else is going on
});

setInterval(async () => {
  const batch = queued.splice(0, 500);
  await db.insertBatch(batch); // 500 a second, on a good day
}, 1000);
Three numbers decide what happens next: the two rates, and how much memory one queued event takes once it is a parsed object rather than JSON on the wire.
- Growth = producer − consumer. Here, 1,500 events a second.
- Memory per second = growth × bytes per event. At 2 KB, that is about 2.9 MB a second.
- Time until out of memory = memory available ÷ that. With 512 MB to spare, about two minutes and fifty-five seconds.
- Events lost at the crash = memory ÷ bytes per event. Here, 262,144 of them.
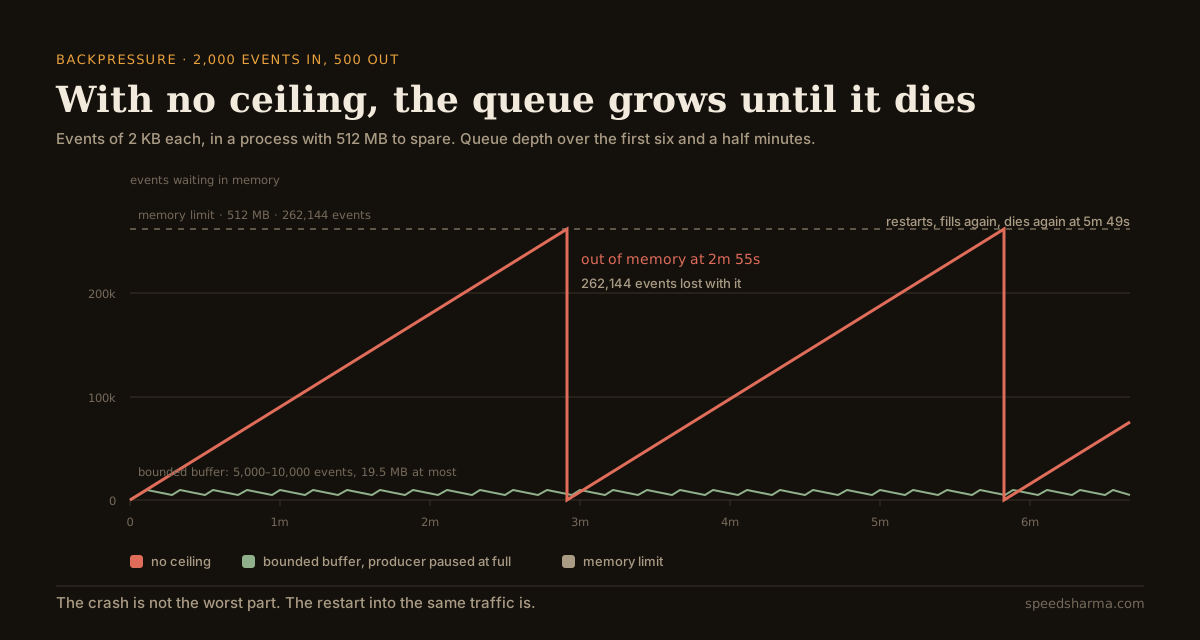
The crash itself is not the worst part. The restart is. The process comes back into exactly the same traffic, fills at exactly the same rate, and dies again on schedule. Google's SRE book describes this pattern in Addressing Cascading Failures: a task evicted for exceeding its resource limits restarts straight into the overload that killed it, and the cycle continues on its own.
And the events are genuinely gone. If your webhook handler answered 200 before pushing onto that array, the sender believes you have the data. Nobody is going to send it again.
Averages hide the spike
The usual objection is that the consumer is faster than the producer on average, and average load is fine. That is true and irrelevant. Queues are built by the peaks.
A consumer that handles 500 a second against a steady 300 has plenty of room. Give it a five-minute spike at 2,000 a second and it is 1,500 a second behind for five minutes: 450,000 events. Once the spike passes, the backlog only drains at the difference in the other direction, 200 a second, which takes over half an hour.
That is the latency problem hiding inside the memory problem. A backlog of 450,000 events with a consumer doing 500 a second means the event at the back is fifteen minutes old when it is finally handled. AWS's David Yanacek calls this bimodal behaviour: "When there is no backlog in the queue, the system's latency is low, and the system is in fast mode. But if a failure or unexpected load pattern causes the arrival rate to exceed the processing rate, it quickly flips into a more sinister operating mode."
Try it with your own numbers
Put in your two rates, the size of one queued event, and what the process is allowed to use. The bounded run pauses the producer when the buffer fills and resumes when it is half empty, which is the pattern the rest of this post builds.
simulator · an in-memory queue with and without backpressure
How long until your queue runs out of memory?
events held in memory over time
Rates are held constant, which is kinder than a real spike that arrives all at once. Memory is counted only for queued events; your process also needs room for everything else. 1 MB here is 1,048,576 bytes, the unit Node's --max-old-space-size flag uses. After a crash the chart assumes the process restarts at once into the same traffic.
quick check
A worker takes 3,000 events a second and processes 1,000. Each queued event holds about 1 KB, and the process has 256 MB of headroom. Roughly how long until it runs out of memory?
The queue grows at 2,000 events a second, which is about 1.95 MB a second. 256 MB divided by that is 131 seconds, or 2 minutes 11 seconds, and the crash takes all 262,144 buffered events with it.
What backpressure actually is
Backpressure is a signal going upstream: stop sending, I am full. Every part of a working pipeline has one. TCP has a receive window. Kafka has consumer offsets, so a consumer that stops polling simply stops receiving. Node streams have a return value.
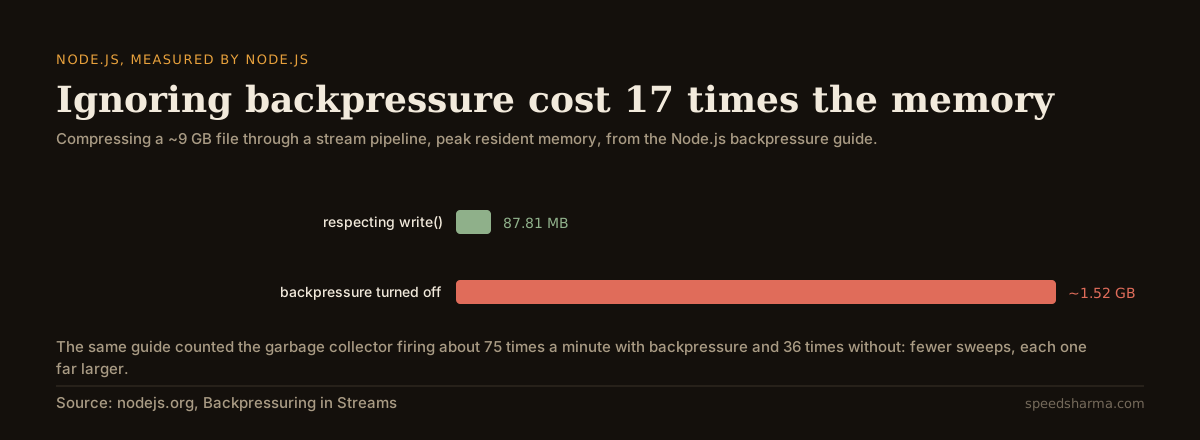
Node's own guide, Backpressuring in Streams, measured what ignoring it costs. Compressing a roughly 9 GB file, the normal build peaked at 87.81 MB of resident memory; a build with backpressure disabled peaked at about 1.52 GB.
The mechanism is two lines of the stream API documentation. write() returns "true if the internal buffer is less than the highWaterMark configured when the stream was created after admitting chunk. If false is returned, further attempts to write data to the stream should stop until the 'drain' event is emitted." And the size of that buffer: "The highWaterMark option is a threshold, not a limit: it dictates the amount of data that a stream buffers before it stops asking for more data." The defaults are 16 objects for object-mode streams, and since Node 22, 64 KiB for byte streams on non-Windows platforms.
The guide also names the exact line that throws all of this away:
// The anti-pattern from Node's own docs: write() returns false and nobody looks.
readable.on('data', (data) => writable.write(data));
Use pipeline instead and the plumbing is handled for you. A batching writer in object mode, with a buffer you chose rather than inherited:
import { pipeline } from 'node:stream/promises';
import { Writable } from 'node:stream';
import { db } from './db';
import type { Event } from './types';

class BatchWriter extends Writable {
  #batch: Event[] = [];

  constructor(private readonly batchSize = 100) {
    super({ objectMode: true, highWaterMark: 1_000 }); // at most 1,000 events waiting
  }

  _write(event: Event, _encoding: BufferEncoding, done: (error?: Error | null) => void): void {
    this.#batch.push(event);
    if (this.#batch.length < this.batchSize) {
      done(); // room for more, immediately
      return;
    }
    this.#flush().then(() => done(), done); // slow path: upstream waits for us
  }

  _final(done: (error?: Error | null) => void): void {
    this.#flush().then(() => done(), done);
  }

  async #flush(): Promise<void> {
    if (this.#batch.length === 0) return;
    const rows = this.#batch;
    this.#batch = [];
    await db.insertBatch(rows);
  }
}

await pipeline(source, new BatchWriter());
The important part is not the batching. It is that done() is called late when the database is slow, so the buffer fills, write() returns false, and the readable side stops reading. The rate limit is the database's, and it propagates all the way back to the socket without anyone writing rate-limiting code.
When there is no stream
Plenty of producers are not streams: an event emitter, a WebSocket, an HTTP handler. Then you apply the pressure yourself, with a bounded buffer, a high-water mark and a low-water mark. Two marks, not one, or you will pause and resume thousands of times a second.
import PQueue from 'p-queue';

const queue = new PQueue({ concurrency: 10 });
const HIGH = 10_000;
const LOW = 5_000;
let paused = false;

source.on('data', (event: Event) => {
  queue.add(() => handle(event)).catch((error) => logger.error({ error }, 'event failed'));

  if (!paused && queue.size >= HIGH) {
    paused = true;
    source.pause();
    logger.warn({ depth: queue.size }, 'queue full, pausing the source');
    // Resolves when queue.size < LOW.
    queue.onSizeLessThan(LOW).then(() => {
      paused = false;
      source.resume();
    });
  }
});
p-queue gives you .size, .pending and onSizeLessThan(limit), which "returns a promise that settles when the queue size is less than the given limit". Note it is ESM-only now, which catches people migrating from older CommonJS code. The .catch matters too: queue.add returns a promise, and an unhandled rejection in a worker is its own way to kill the process.
A durable queue — BullMQ on Redis, SQS — is the other half of this. It moves the buffer out of process memory, so a crash stops being a data-loss event. At TRIBE that is where the heavy work ended up, on BullMQ and AWS SQS, and at PostEngage every external call is a job with retries, dead-lettering and alerts. But a durable queue is storage, not backpressure: Redis has a memory limit of its own, and a queue you never drain becomes a backlog that outlives the incident. Something still has to slow the producer down or turn work away.
Where the excess actually goes
Once the buffer is bounded, the interesting question is what happens to the work that does not fit. There are four answers, and the choice is a product decision as much as an engineering one.
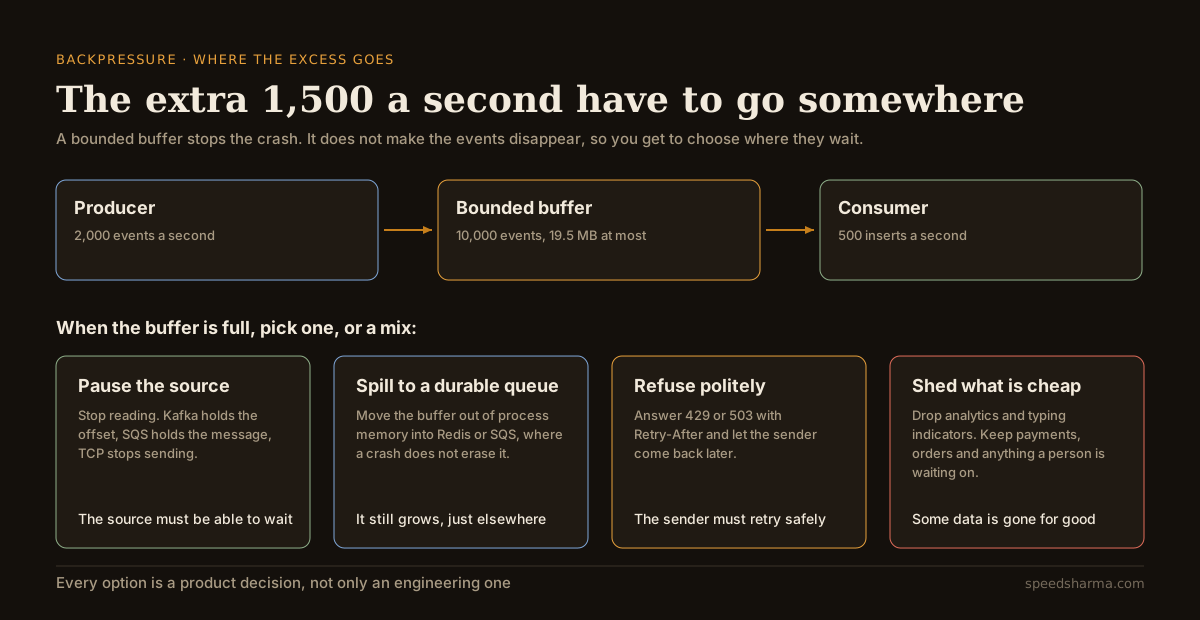
Pause the source. The cleanest option when the source can wait: Kafka holds the offset, SQS holds the message until the visibility timeout passes, TCP stops sending. Nothing is lost, and the pressure ends up wherever the data was already sitting.
Spill to a durable queue. Good when the source cannot wait but the work can. You have not reduced anything, you have moved it somewhere a restart does not erase.
Refuse politely. For a synchronous API, returning 429 — "the user has sent too many requests in a given amount of time" — or 503, with a Retry-After header, is backpressure over HTTP. The SRE book's advice on queue sizing points the same way: keep "small queue lengths relative to the thread pool size (e.g., 50% or less), which results in the server rejecting requests early when it can't sustain the rate of incoming requests." Refusing means the sender retries later, which is only safe if your endpoints are idempotent.
Shed what is cheap. When the choice is between dropping analytics and dropping payments, drop analytics. Decide the priority order before the incident, in code, not in the moment.
| Unbounded array | Bounded buffer with pause and resume |
|---|---|
| Memory: grows with the backlog, without limit | Fixed at buffer size × event size |
| Failure mode: out of memory, with no warning | Slow consumer, visible in metrics for hours |
| Lost on crash: everything queued | Nothing that was in memory |
| Where the excess waits: your heap | The source, a durable queue, or refused |
| What it needs from the source: nothing | The ability to wait, or to be told no |
| What you find out at 3am: the process is gone | Nothing; you find out during office hours |
Backpressure is not automatically right, either. Yanacek is honest about this: "in systems that perform order processing for amazon.com, we tend to prefer to accept orders even if a backlog builds up, rather than preventing new orders from being accepted". Taking the order and being slow beats refusing the order. That is a business call, and it comes with an obligation to prioritise what you accepted.
What to watch
Queue depth alone is a poor alarm. It is large during a healthy burst and small during a total outage, when nothing is arriving at all.
- Age of the oldest item. AWS measures this deliberately: "we focus more on measuring the age of messages that are in the queue. This quickly catches cases where the systems are behind." Depth is a size; age is a promise you are breaking.
- The growth rate. Depth rising steadily for five minutes is a better alert than any threshold, because it fires before the number gets big.
- Heap used.
process.memoryUsage().heapUsednext to your queue depth tells you which of the two is really growing. - Paused time. If your producer is paused 75% of the time, backpressure is working and you have a capacity problem to solve calmly, before it becomes an outage.
- Drain time. Depth divided by consumer rate. It is the honest answer to "how far behind are we?" and it belongs on the dashboard next to the depth.
None of these need a new tool. They need one log line every ten seconds with the four numbers in it, which is also the cheapest way to find out that the thing you thought was the bottleneck is not.
questions people ask
What is backpressure in Node.js?
It is the mechanism a stream uses to tell its source to slow down. writable.write() returns false when the internal buffer has passed the highWaterMark, and the writer should stop until the drain event fires. Using pipeline() handles this for you across the whole chain.
What happens if you ignore backpressure?
Data piles up in memory until the process is killed, and everything buffered is lost. Node's own guide measured a job peaking at about 1.52 GB with backpressure disabled against 87.81 MB with it respected.
What is a good highWaterMark?
Small enough that the buffer cannot exhaust memory and large enough to keep the consumer busy. It is a threshold, not a hard limit. The defaults are 16 objects in object mode and, since Node 22, 64 KiB for byte streams on non-Windows platforms.
Does a message queue like SQS or BullMQ give me backpressure?
Not by itself. It moves the buffer out of process memory, so a crash does not lose the work, but the backlog still grows and still has to be drained. You need the consumer to stop pulling, or the producer to be refused, for pressure to actually reach the source.
How do I apply backpressure over HTTP?
Return 429 or 503 with a Retry-After header when your queue is above its high-water mark, and keep the queue small relative to your worker pool so you reject early rather than timing out late. Clients then need to retry safely, which means idempotent endpoints.
How long until my queue runs out of memory?
Divide the memory the process can use by the growth rate in bytes a second, where growth is producer rate minus consumer rate times the size of one queued event. At 1,500 extra events a second of 2 KB each in 512 MB, that is under three minutes.
The short version
Write down every place work changes hands: socket to handler, handler to worker, worker to database, service to third party. For each one, write the arrival rate, the completion rate, and how much memory one waiting item takes. Where arrivals can exceed completions, you have a queue, and if it has no ceiling you have a scheduled crash.
Put a bound on it. In Node, use streams and pipeline so write() and drain do the work. Where that does not fit, use a bounded queue with a high and a low mark, pause the source at one and resume at the other. Then decide, deliberately, where the excess waits: at the source, in a durable queue, refused with a 429, or dropped because it was never worth much. Anything you have not decided is decided by the out-of-memory killer, and it always chooses "lose it all".
Then measure the age of the oldest item, not just how many there are. Getting slower is a problem you can fix on a Tuesday afternoon. Falling over is one you fix at 3am, twice, because uptime is the product of every dependency and a crash loop takes out more than the queue.