"Keep utilisation under seventy per cent" is the most widely repeated capacity rule in the industry, and it is usually stated without the one thing that determines whether it is true. Run the queueing arithmetic and the knee moves by an order of magnitude depending on how many requests your service handles in parallel.
That matters because the rule is expensive when it is wrong. A team running a forty-worker pool at 60% because of it is buying a third more machines than it needs. A team running a single-threaded consumer at 85% because the dashboard looks fine is about to find out what a queue does.
Where the knee actually is
The queueing model behind all of this is M/M/c: random arrivals, exponential service times, and c workers. It is wrong about the details of any real service and right about the shape, and the shape is not a single curve. It is a family of curves indexed by c.
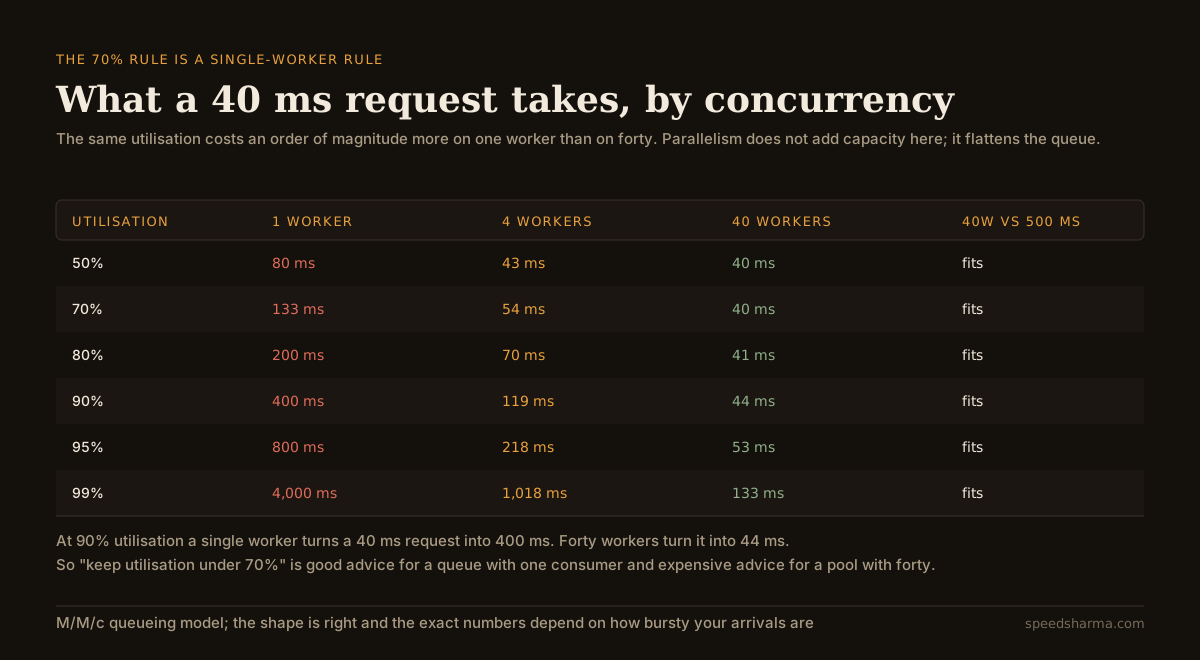
Read the 90% row. A single worker at 90% utilisation adds 360 ms of queueing to a 40 ms request. Forty workers at the same 90% add four. The difference is not capacity — both are at 90% of their own capacity — it is that with forty workers, a burst of arrivals finds one of them free, and with one worker it waits behind whatever is in progress.
This is why the folk rule survives despite being wrong half the time: it was learned on single-consumer queues, where it is excellent advice, and then applied to HTTP worker pools where it costs money. If your service is a worker consuming a queue one job at a time, stay well under 70%. If it is forty threads behind a load balancer, 90% is comfortable and 95% is arguable.
The general shape has a name in queueing theory — square-root staffing — and the useful version of it is directional rather than precise: the more requests you serve in parallel, the closer to full you can safely run. Doubling the workers does not double the safe utilisation, but it moves it up, and the move is large in exactly the range teams care about. Which is why the honest form of the rule is not a percentage at all; it is "measure your own curve, and state the concurrency when you quote a number".
Utilisation of what, though
Before using any of this there is a prior question, and the SRE book on handling overload is emphatic about it: request rate is the wrong denominator. "Different queries can have vastly different resource requirements", and the mix between them changes, so "modeling capacity as 'queries per second'... often makes for a poor metric."
What Google uses instead is resource consumption: capacity measured "directly in available resources", with the cost of a request defined as "a normalized measure of how much CPU time it has consumed". The conclusion is refreshingly plain — "simply using CPU consumption as the signal for provisioning works well".
So the practical version of the rule is: measure utilisation as CPU, not as requests per second against a number somebody load-tested in March. A service whose traffic mix has shifted towards expensive queries is at a higher utilisation than its request graph shows, and the queueing curve is exactly where that discrepancy turns into latency.
Work out where your own knee is
calculator · load shedding
When should you start refusing work?
what a request takes, by utilisation, at this service time
your traffic, with and without shedding
The queueing model is M/M/c: arrivals are random, service times are exponential, and there are as many workers as the capacity and service time imply. Real services have neither property, so read this as the shape rather than as your p99 — the shape being that waiting time is flat until it is not, and that where the knee sits depends heavily on how many requests you serve in parallel. It also assumes an unbounded queue, which is the whole problem: a bounded queue that rejects work is precisely the fix being measured here. Capacity should be the rate at which the service actually completes work under load, which is usually well below the rate at which it accepts it.
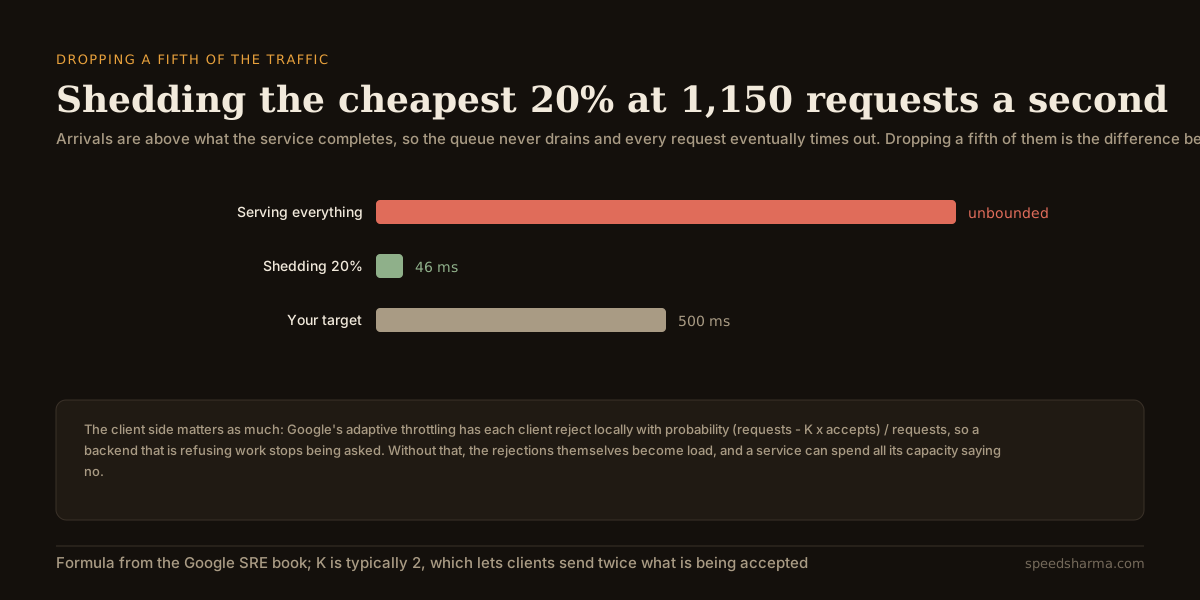
The default is a service being asked for more than it can complete: 1,150 requests a second arriving at something that finishes 1,000. There is no latency number for that, because the queue never drains. Every request eventually times out, and the ones that do not are answered slowly enough that nobody wanted them.
Things worth trying:
Set the work per request to 400 ms. Same capacity, same arrival rate, but now there are four workers instead of forty, and the service falls apart far earlier. Long requests and high concurrency are two different systems wearing the same utilisation number.
Set arrivals to 990. Just inside capacity, and the latency is fine. That is the honest version of "we are at 99% and everything is OK" — it is true right up until it is catastrophically not, and there is no warning in between because the curve has no middle.
Raise the sheddable share. This is the only lever in the calculator that acts instantly. Capacity takes minutes to arrive from an autoscaler and hours from a purchase order.
Shedding is prioritisation, not rejection
The word makes it sound like a failure mode. It is a decision about which requests get served with the capacity you have, made in advance instead of by whichever ones happened to arrive first.
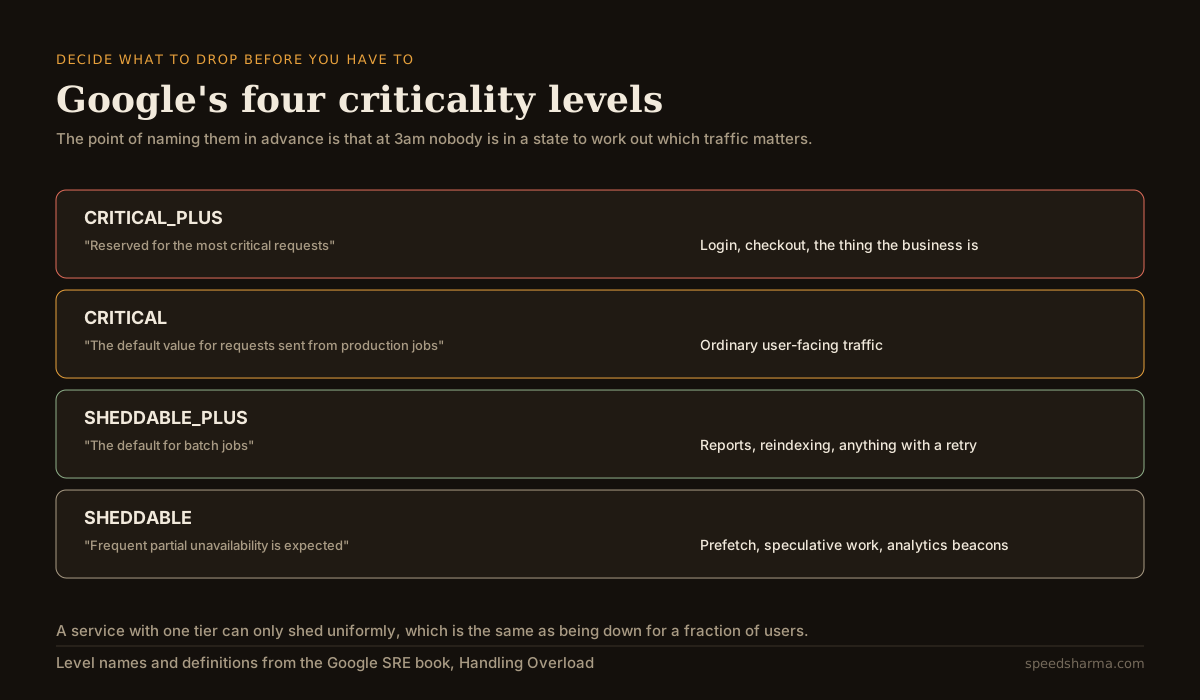
The four levels are CRITICAL_PLUS ("reserved for the most critical requests"), CRITICAL ("the default value for requests sent from production jobs"), SHEDDABLE_PLUS ("the default for batch jobs") and SHEDDABLE ("traffic for which frequent partial unavailability... is expected").
The value is not in the names. It is that the labelling happens in a design review rather than during an incident, and that it makes the trade explicit: a service that has never classified its traffic can only shed uniformly, which means every user gets a worse experience instead of some requests getting none.
There is a second mechanism worth adopting with it, which the same chapter describes: graceful degradation. Under overload, serve "responses that are not as accurate as or that contain less data than normal responses, but that are easier to compute". A search that returns the cached top ten instead of a fresh ranked set is doing more useful work per CPU-second than a queue of perfect answers nobody is still waiting for.
The client has to cooperate
A backend that refuses work is only helped if the refusals get cheaper than the work. When they do not — when every rejected request is retried immediately by a client that does not know any better — the rejections become the load, and a service can spend all of its capacity saying no.
The SRE book's answer is client-side adaptive throttling. Each client tracks its own requests and accepts, and when requests exceed K × accepts it starts rejecting locally, with probability:
P(reject) = (requests − K × accepts) / requestsWith K = 2, a client will keep sending twice what is being accepted and then throttle itself, without any coordination and without asking the backend first. The backend's job becomes signalling honestly; the client's job is believing it.
This pairs with the other half of the same problem, which is that retries multiply down a call chain. Shedding at the server and throttling at the client are the two ends of one mechanism, and doing only the first is how a service ends up refusing 90% of a load made entirely of retries.
| What happens under overload | Rejecting at the server only | Rejecting at the server and client |
|---|---|---|
| Clients retry immediately, load stays high | Clients throttle themselves before sending | |
| Rejections consume connection and CPU | Most rejected work never reaches the network | |
| Capacity is spent producing 503s | Capacity goes to the requests that got through | |
| Recovery needs the traffic to stop | Recovery is automatic as accepts rise | |
| Backend sees the full retry storm | Backend sees roughly K times what it accepts |
quick check
Two services both sit at 90% CPU. One is a thread pool serving 40 requests in parallel; the other is a single-threaded queue consumer. Which is closer to trouble?
At 90% utilisation the M/M/c model gives about 44 ms for forty workers and about 400 ms for one, on the same 40 ms of work. Utilisation only means something once you also know how many requests are in flight at once — which is why a single number copied between services is a bad capacity signal.
Where to put the shed decision
Three places, and they catch different things.
| Where | What it can see | What it cannot |
|---|---|---|
| Load balancer | Connection counts, request rate | How expensive each request is |
| Server admission control | Its own CPU, queue depth, latency | The cost to the client of being refused |
| Client throttling | Its own success rate | Whether the backend prefers other clients' traffic |
Server-side admission control on queue depth is the one to build first, because it is the only one that can act on the signal that actually matters: the service's own measured latency against its target. The rule is simple — if the request at the head of the queue has already waited longer than the deadline, drop it rather than serve it, because nobody is waiting for the answer. Envoy ships this as adaptive concurrency, which samples latency and derives a concurrency limit from it rather than from a number someone typed. That check alone converts a collapsing service into a degraded one.
The load balancer is the worst place to put the whole decision, because it knows the least about cost, but it is the right place to enforce per-client fairness so that one badly behaved caller cannot consume the whole budget.
What the model does not capture
Real arrivals are burstier than this. M/M/c assumes Poisson arrivals. (Little's law — queue length equals arrival rate times waiting time — needs no such assumption, but it gives you the average, and the average is not the part that breaks.) Real traffic has correlated bursts — a push notification, a cron job, a cache expiring — and burstiness makes every number here worse. Treat the table as a floor on the queueing cost, not a forecast.
Capacity is not a constant. The model treats the service rate as fixed, and under load it is not: garbage collection gets worse, caches get colder, and lock contention rises. So the real curve bends earlier than the model does, which is another argument for shedding sooner than the arithmetic suggests.
Queue depth is a lagging signal. By the time the queue is deep the latency is already bad, because the queue is the latency. Admission control on measured wait time reacts earlier than admission control on depth, and both react later than a request rate limit, which is why the layered approach exists.
Dropping work has a cost the calculator cannot price. A shed analytics beacon is free; a shed checkout is revenue. That is the same arithmetic as what an hour of downtime costs, applied per request class rather than per hour, and it is the reason the tiers have to be decided by someone who knows what the business is.
Sometimes the answer really is more capacity. If your sheddable share is 5% and you are 30% over, prioritisation cannot save you. The calculator says so directly, and it is worth believing: load shedding buys time and protects the important traffic, but it is not a substitute for a service that is simply too small.
questions people ask
What utilisation should I run my service at?
It depends on how many requests you serve in parallel. With a single worker, queueing is already painful at 70%. With forty workers in a pool, 90% costs about 10% extra latency and 95% is defensible. The knee is roughly at 1 minus 1 over the square root of the concurrency, so state the concurrency before quoting a percentage.
Why is the 70% utilisation rule wrong?
It is not wrong, it is incomplete. It comes from single-server queueing, where waiting time rises steeply well before saturation. Adding parallel workers flattens that curve dramatically: the same 90% utilisation costs 400 ms on one worker and 44 ms on forty for the same work.
What is load shedding and when should it start?
Refusing lower-priority work so that higher-priority work still meets its latency target. It should start at the arrival rate where queueing alone pushes you past that target, which is well before anything falls over — not when the service is already failing.
How do I decide what traffic to shed?
In advance, in a design review, not during an incident. Google uses four criticality levels from CRITICAL_PLUS down to SHEDDABLE, with batch jobs defaulting to sheddable and user-facing traffic to critical. The useful output is a label on every request path, applied by the caller.
Should clients retry when they are shed?
Only with a budget. Google's adaptive throttling has each client reject locally once requests exceed K times accepts, with probability (requests − K × accepts) / requests, so a struggling backend stops being asked. Without something like it, retries turn a shed into a storm.
Is queue depth a good signal for shedding?
It is better than nothing and worse than latency. Depth is a lagging indicator, because the queue is where the latency lives. Dropping requests whose wait already exceeds the deadline is the single most effective admission rule, since those responses have no value left.
The short version
Utilisation on its own is not a capacity signal. The same 90% costs 400 ms of queueing on one worker and 4 ms on forty, so any rule stated as a bare percentage is either leaving money on the table or about to fall over, and you cannot tell which without knowing the concurrency.
Measure utilisation as CPU rather than request rate, because the request mix moves and a query is not a unit of work. Then find the arrival rate at which queueing alone breaks your latency target, and start shedding there — not when something crashes.
Shedding is prioritisation. Decide the tiers in a design review, degrade gracefully rather than failing, and pair server-side admission control with client-side throttling, because a service that refuses work without the clients cooperating just spends its capacity on saying no.