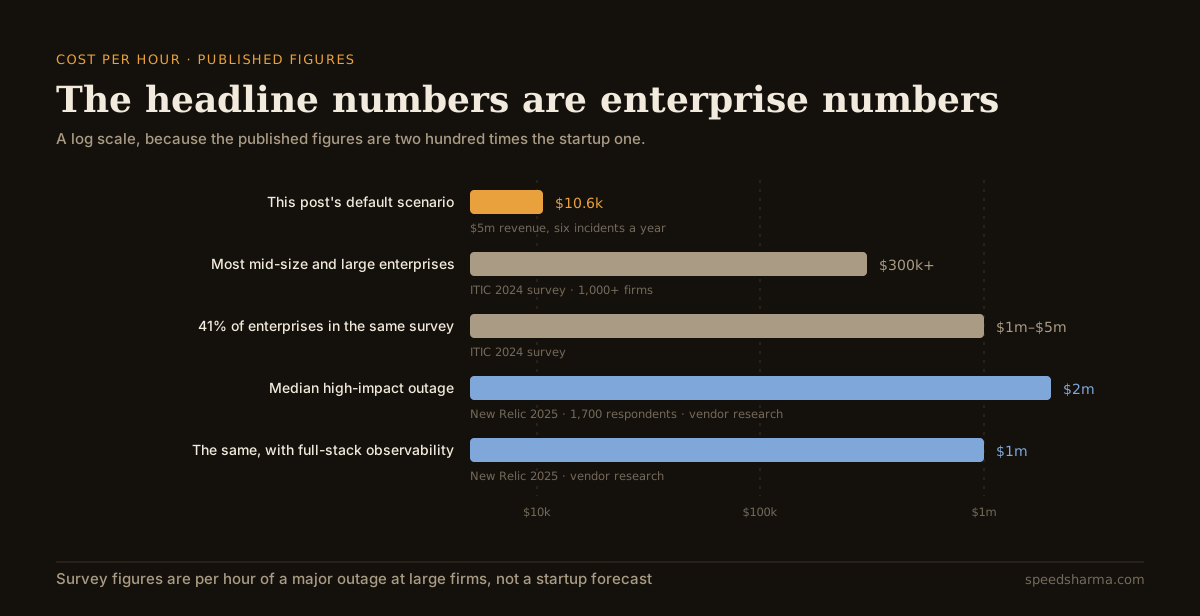
Search for the cost of downtime and you will find some very large numbers. ITIC's 2024 survey of over 1,000 firms reported that an hour of downtime costs more than $300,000 for over 90% of mid-size and large enterprises, with 41% putting it between $1 million and more than $5 million. New Relic's 2025 Observability Forecast, which is vendor research, puts the median high-impact outage at $2 million an hour.
Those numbers are real, and they are not yours. They come from surveys of large enterprises, where an hour of downtime interrupts a stream of transactions that will never come back. If you are a startup doing a few million in annual revenue, quoting $300,000 an hour in a board deck will get you laughed at, and it will also hide the lines that actually cost you money.
The useful exercise is arithmetic on your own numbers. When I built EMPRO alone and ran it at 99.9% uptime through launch and handover, that number was not a badge. It was a budget: 99.9% allows 43 minutes and 50 seconds of downtime in an average month, and knowing that shaped what I could promise the client. This post takes an hour of downtime apart into the six lines that show up in a real business, gives you a calculator, and works out what one more nine is worth.
The six lines on the bill
Interrupted revenue. Annual revenue, times the share that flows through the system, divided across the 8,766 hours in a year. This is the line everyone starts with and the one most often overstated. If you sell monthly subscriptions, an outage on Tuesday does not delete Tuesday's revenue; the customer still pays at the end of the month. If you take payments per transaction, or your customers can buy from a competitor in the meantime, the money is genuinely gone. The honest way to fill this in is to ask what share of interrupted revenue you lose rather than defer.
SLA credits. If you sign contracts promising uptime, you have agreed to pay for missing it. This line is a cliff: nothing until you cross the threshold, then a fixed percentage of the month's fees. It is also the line founders sign away most casually, usually years before anyone measures whether they can meet it.
The people pulled in. Four people for ninety minutes is six person-hours that were meant to be spent on something else, and the cost is their loaded hourly cost, not their take-home pay.
The engineering afterwards. This is the line teams forget. The incident lasts ninety minutes; the real fix, the data backfill, the write-up and the follow-up changes take days. In my estimate, the work after an incident is usually several times the work during it.
Support and communications. Tickets, replies, an apology email, an update on the status page, and the account manager's call with the customer who noticed first.
Churn. The hardest line to measure and often the largest. One outage rarely loses a customer; the third one in a quarter does, and it is also the reason the renewal conversation goes badly.
Why the published benchmarks are not your benchmark
Uptime Institute's 2026 analysis found that 57% of respondents said their most recent major outage cost more than $100,000, and for the second year running one in five put it above $1 million. That is per outage, not per hour, and the respondents run data centres. ITIC's and New Relic's figures are per hour and come from enterprises. Comparing any of them to a seed-stage SaaS is comparing populations, not companies.
There is one number in that research worth borrowing, though. New Relic reports that 41% of leaders still learn about service interruptions from customer complaints, tickets or manual checks. That is a detection problem, and detection time is part of every line above: it extends the outage, the response, the support load and the apology.
Work out your own number
The defaults describe a company with $5 million of annual revenue, 80% of it flowing through the product, six incidents a year at ninety customer-facing minutes each, four responders at $90 an hour loaded, sixteen hours of engineering after each incident, eight hours of support, and 99.9% promised to the 40% of revenue that sits on contracts with credits.
calculator · the annual bill, and what a nine is worth
What an hour of downtime costs you
the business
the incidents
the contracts
where the annual cost sits
Revenue interrupted is annual revenue times the share above, spread evenly across 8,766 hours; for subscription products much of that is deferred, not lost, which is why the share field matters. Credits assume incidents fall in separate months, up to twelve, and are only paid in months where downtime exceeds what your promised uptime allows. Churn is scaled with total downtime, so the "one more nine" figure assumes the same number of incidents, each a tenth as long.
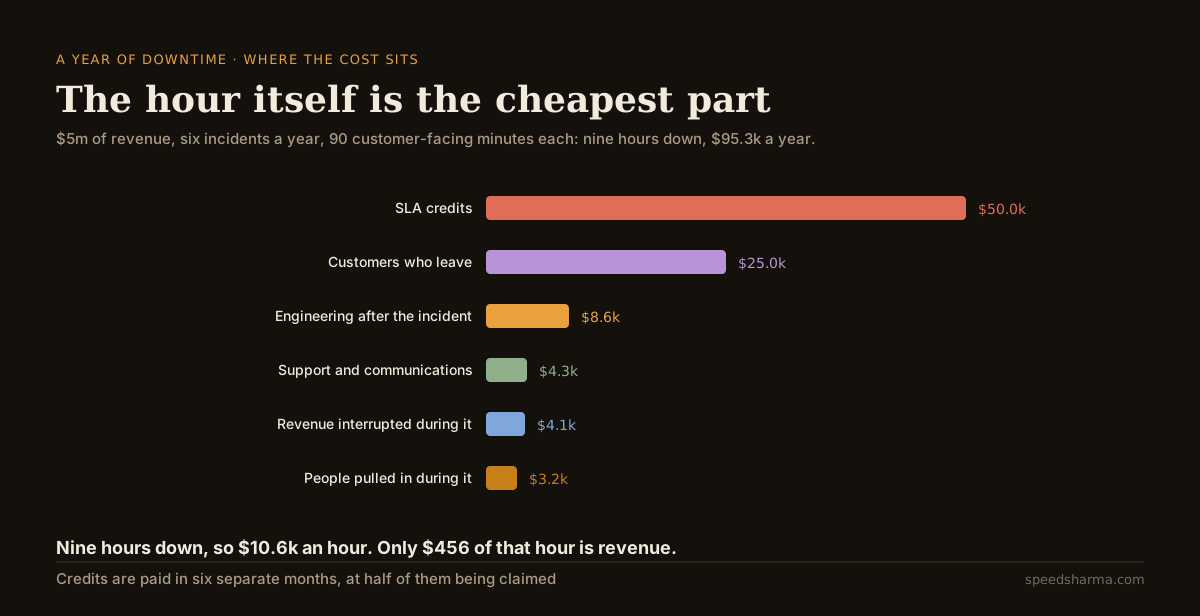
That scenario costs about $95,300 a year, which is $10,600 an hour of downtime, or $15,900 an incident. Only $456 of each hour is interrupted revenue. The largest lines are SLA credits at $50,000 and churn at $25,000, and neither is really a function of how long the outage lasted. Credits depend on crossing a threshold. Churn depends on how many times it happened and how you communicated.
Change the inputs and the shape changes completely. Set the SLA share to zero and the bill drops by half. Make the product transactional by raising the share of revenue lost rather than deferred, and interrupted revenue takes over. That variation is the point: there is no industry figure for what your downtime costs, because the answer depends on what you sell and what you signed.
Cost per hour is a blunt instrument
Dividing an annual cost by annual downtime hides something important: most of the lines are not hourly. Engineering afterwards, the support load and much of the churn depend on how many incidents you had, not how long they ran. Interrupted revenue and the responders' time depend on the length. Credits depend on neither: they depend on a threshold.
That matters because the two obvious improvements do different things. Cutting the number of incidents in half removes the fixed costs of each one. Cutting the length of each incident in half removes only the variable costs, unless the reduction takes you under a contractual threshold, in which case it removes the largest line entirely. Work out which lever you are pulling before you spend a quarter on it.
Cost per incident is the more honest headline for a small company. It is the number to put next to "what would it cost to stop this class of incident happening again?".
What one more nine is worth
The nines ladder is unforgiving, and most people cannot recall it under pressure.
| Uptime promised | Per month | Per year | A 90-minute incident |
|---|---|---|---|
| 99.5% | 3 h 39 m | 43.8 h | no breach |
| 99.9% | 43 m 50 s | 8.8 h | breach |
| 99.95% | 21 m 55 s | 4.4 h | breach |
| 99.99% | 4 m 23 s | 0.9 h | breach |
In the default scenario, nine hours of downtime a year is 99.8973% availability. Cutting each incident from ninety minutes to nine takes it to 99.9897%, roughly one more nine, and the calculator puts the value of that at about $79,100 a year. Most of that saving is not the recovered revenue, which is trivial. It is that a nine-minute incident no longer breaches the 43 minutes and 50 seconds that 99.9% allows, so the credits stop.
Be careful reading that as a general rule. Google's SRE book makes the counterpoint bluntly: "an incremental improvement in reliability may cost 100x more than the previous increment", and it points out that a user on a 99% reliable phone cannot tell 99.99% from 99.999%. Nines are worth buying up to the point where a contract, a customer or a regulator cares, and rarely past it. The composite arithmetic also sets a ceiling: if your dependencies multiply out to 99.7%, no amount of effort on your own code will let you promise 99.99%.
It is worth knowing what your own providers pay when they miss. AWS's compute SLA credits 10% of the bill when regional uptime falls below 99.99%, 30% below 99.0% and 100% below 95.0%. A 10% credit on a $2,000 monthly bill is $200. If your contract with your customer pays out 10% of a $10,000 monthly subscription for the same outage, you are underwriting the difference.
quick check
Your contract promises 99.9% uptime. One incident lasts 90 minutes. What does that mean for that month?
99.9% of a 730.5-hour month leaves 43 minutes 50 seconds. A single 90-minute incident is more than double the monthly allowance, so the credit is owed on that incident alone.
The cheapest ways to cut the bill
Ranked by what they cost you to do, not by how impressive they sound.
- Find out sooner. If customers are telling you first, every line above gets longer. Alert on what customers experience, not on CPU. My rule from running PostEngage alone is that a system which cannot explain its own failure in the alert it sends is not finished, because at 2am there is nobody to ask. This is also why logging everything is not the same as being able to see an incident.
- Make rollback boring. Most incidents in young systems come from a change. A scripted, practised rollback turns a ninety-minute incident into a nine-minute one, which is precisely the move the calculator prices.
- Degrade instead of failing. Serving stale data, queueing work that can wait, and taking a struggling dependency off the critical path all convert an outage into a slow patch. The failure modes to plan for are backlogs that explode and missing backpressure, because a badly handled recovery is its own outage.
- Write the status page updates in advance. Support load and churn both respond to communication. Templates written on a calm afternoon are better than anything anyone writes during an incident.
- Read your own contracts. Then decide whether the promise you made matches the architecture you have. Renegotiating a threshold is cheaper than engineering your way under it.
Notice what is not on the list: a second region. Multi-region is real engineering with real running costs, and for most companies below enterprise scale it buys a nine they were not contractually required to have.
questions people ask
How much does an hour of downtime cost?
For a startup with a few million in revenue, usually thousands rather than hundreds of thousands. The often-quoted figures of $300,000 to $2 million an hour come from surveys of mid-size and large enterprises and do not transfer. Work it out from your own revenue, contracts and incident pattern.
How do you calculate the cost of downtime?
Add interrupted revenue, SLA credits, the loaded cost of everyone pulled into the incident, the engineering hours afterwards, the extra support load, and an estimate of churn. Divide by incidents for a cost per incident, which is more useful than a cost per hour.
What is the average cost of downtime per hour?
ITIC's 2024 survey of more than 1,000 firms reported over $300,000 an hour for over 90% of mid-size and large enterprises, and New Relic's 2025 vendor research put the median high-impact outage at $2 million an hour. Both describe enterprises, not startups.
How much downtime does 99.9% uptime allow?
43 minutes and 50 seconds in an average month, and 8 hours 46 minutes a year. 99.99% allows 4 minutes 23 seconds a month.
Are SLA credits worth claiming?
They are usually capped at a percentage of what you paid that provider, which is small next to what the outage cost you. They matter more in the contracts you sign with your own customers, where the payout is a share of your revenue.
Is it worth paying for an extra nine of availability?
Only when something concrete depends on it: a contract with credits, a customer who will leave, or a regulator. Reliability gets sharply more expensive per increment, and users cannot perceive the difference above a certain point.
The short version
An hour of downtime is not one number, it is six lines, and for most startups the hour itself is the cheapest of them. Interrupted revenue is usually smaller than founders fear, while SLA credits and churn are larger and behave differently: credits are a cliff at a contractual threshold, churn is a function of how often it happens and how you handled it.
So do the arithmetic on your own inputs, quote cost per incident rather than cost per hour, and spend on reliability where it crosses something concrete. Faster detection and a practised rollback are worth more than a second region, and they are the difference between a ninety-minute incident and a nine-minute one.