Every team that picks an SLO picks it the same way. Someone says "we should be 99.9%", nobody objects because objecting sounds like arguing for outages, and it goes in a document. Nine months later there is a deploy freeze and an argument about whether the freeze is reasonable, and nobody connects the two events, because the meeting where the number was chosen never mentioned deploys.
It should have. An SLO is not a quality bar. It is a release allowance, and the exchange rate is fixed: 99.9% over thirty days is forty-three minutes, and every bad deploy has a price in those minutes. If you know your change failure rate and how long it takes you to mitigate, the number of deploys the objective pays for is a division, not an opinion.
The budget is the SLO's other half
The Google SRE book defines it in one sentence: "The difference between these two numbers is the 'budget' of how much 'unreliability' is remaining for the quarter." The objective says how good you intend to be; the budget says how much badness that entitles you to before something has to change.
What makes it a budget rather than a report is the policy attached to it: "As long as the uptime measured is above the SLO — in other words, as long as there is error budget remaining — new releases can be pushed," and "If SLO violations occur frequently enough to expend the error budget, releases are temporarily halted while additional resources are invested in system testing."
That is the trade being made. You are buying release velocity with unreliability, on credit, and the SLO sets the credit limit. A team that has never framed it that way is usually running a very small credit limit and wondering why everything feels slow.
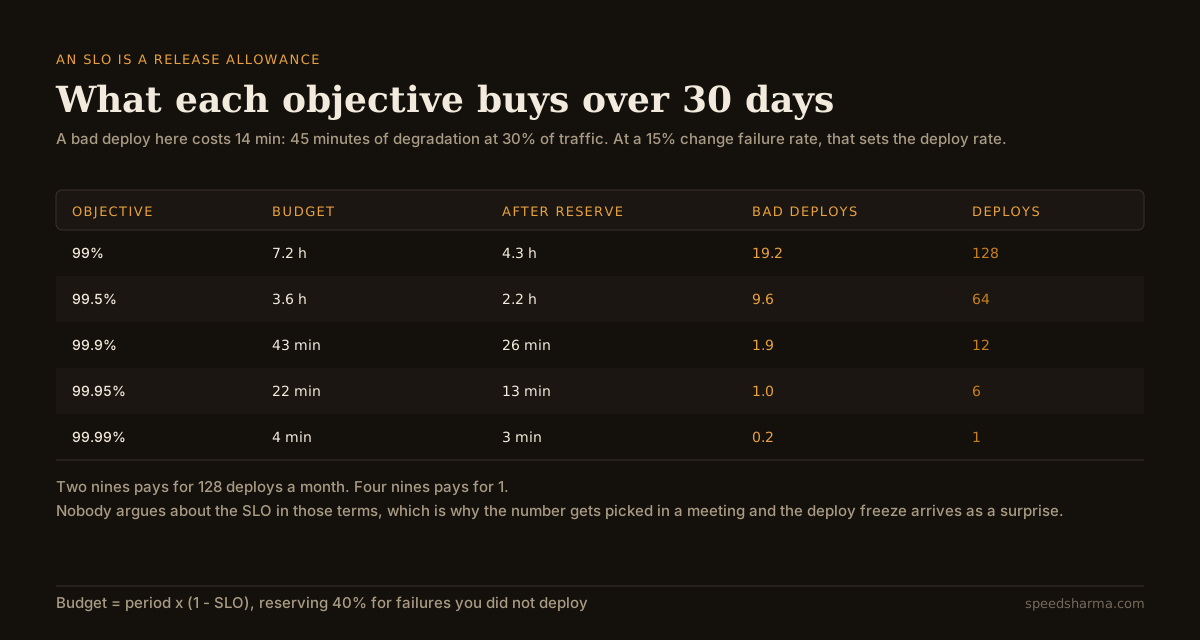
Look at the last column. Two nines pays for 128 deploys a month, and four nines pays for one. Nobody chooses between "99%" and "99.99%" with that column in front of them, which is exactly why the choice keeps going badly.
What a bad deploy actually costs
The unit that makes this work is full-outage-equivalent time. A failure that breaks 30% of requests for 45 minutes spends the same budget as one that breaks everything for 13.5 minutes, because the budget is really a count of failed requests wearing a clock's clothing.
That is also why the SRE workbook prefers request-based SLIs, defined as "the ratio of two numbers: the number of good events divided by the total number of events", over the time-based availability most status pages show. Good events over valid events "lends itself easily to the concept of an error budget"; minutes of downtime do not, because they cannot express a partial failure without inventing a rule for what counts as "down".
So the cost of one bad deploy is two numbers you already have:
- How long from the deploy landing to traffic being healthy. Not time to fix the bug — time to stop the bleeding, which is usually a rollback. This is the number a good deploy pipeline attacks.
- What share of traffic it breaks. A canary that catches it at 5% of traffic makes the same bug twenty times cheaper than a full rollout does.
Both are under your control, and neither is the SLO. That is the useful part: when the budget does not cover the release plan, there are four levers and only one of them is "ship less".
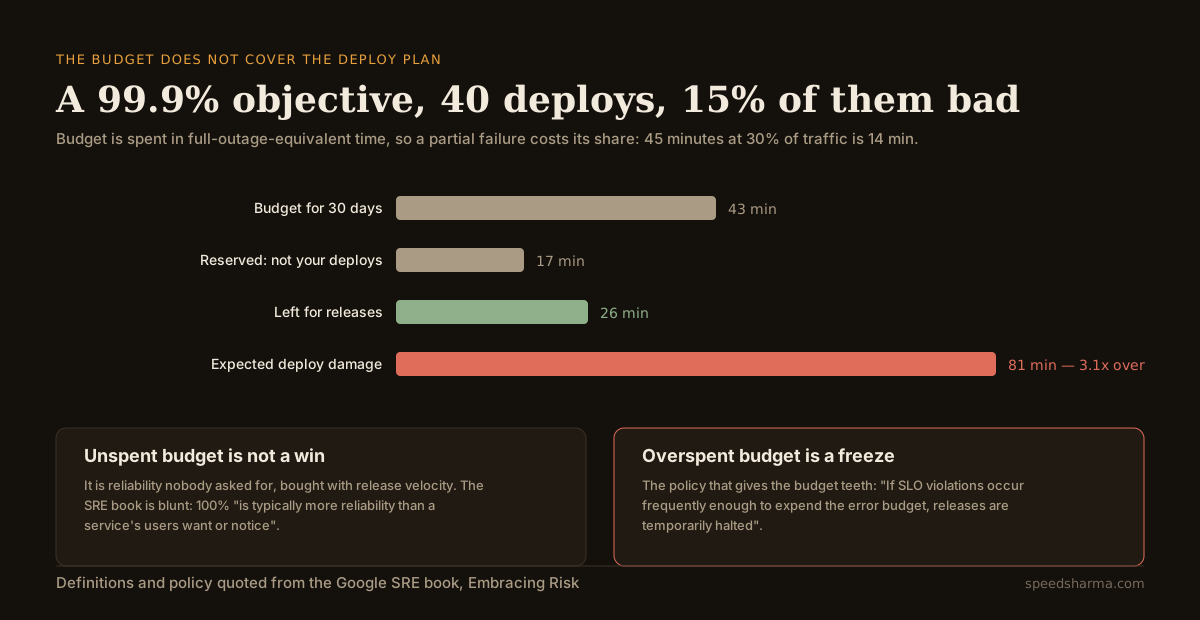
The default scenario in the calculator is not a strawman. Forty deploys a month is a team shipping twice a business day. A 15% change failure rate is mediocre but common. Forty-five minutes to detect and mitigate is a team with alerting and a rollback button. And the arithmetic says that team cannot hold 99.9% — they are planning to spend about 81 minutes of a 26-minute release allowance.
They will not see it that way. They will see an objective that is "missed sometimes" and an SRE team that "wants to slow us down", and both groups will be right about the facts and wrong about the cause.
Work out your own allowance
calculator · error budget
How many deploys does your SLO pay for?
what each objective leaves you over this period
where the budget goes at your deploy rate
Budget is expressed as full-outage-equivalent time, which is what makes partial failures comparable: forty minutes at 30% of traffic spends the same budget as twelve minutes at 100%. That equivalence assumes traffic is roughly even across the window and that every failed request costs the same, neither of which is quite true. The burn rate follows the standard definition — the error rate divided by the rate the SLO allows — so a total outage against a 99.9% objective burns at 1000× and drains a 30-day budget in about 43 minutes.
The reserve field is the one people leave at zero the first time. Your budget pays for everything, not just your mistakes: the cloud provider's bad afternoon, a dependency's expired certificate, the database failover that took longer than the runbook claimed. Reserving nothing for those means the first incident you did not cause takes your entire release allowance with it. Forty per cent is a starting point; pull last quarter's incidents apart by cause and use the real split.
Three experiments, in order of how much they will surprise you:
- Set impact to 5%. That is a canary or a progressive rollout catching the bug early. Deploy capacity goes up six-fold, from the same SLO and the same failure rate.
- Set mitigation to 10 minutes. Automatic rollback on an SLO burn alert. Roughly four times the deploys, again with nothing else changed.
- Set the SLO to 99.95%. Half the budget, half the deploys. This is the "let's be more ambitious" decision, priced.
The first two are engineering work with a known payoff. The third is a decision that looks free in a planning document and costs half your release velocity.
Burn rate: the same arithmetic, during an incident
The budget answers "how often can we ship". Burn rate answers "is this incident worth waking someone for", and it is the same division seen from the other end: the error rate divided by the rate the objective allows.
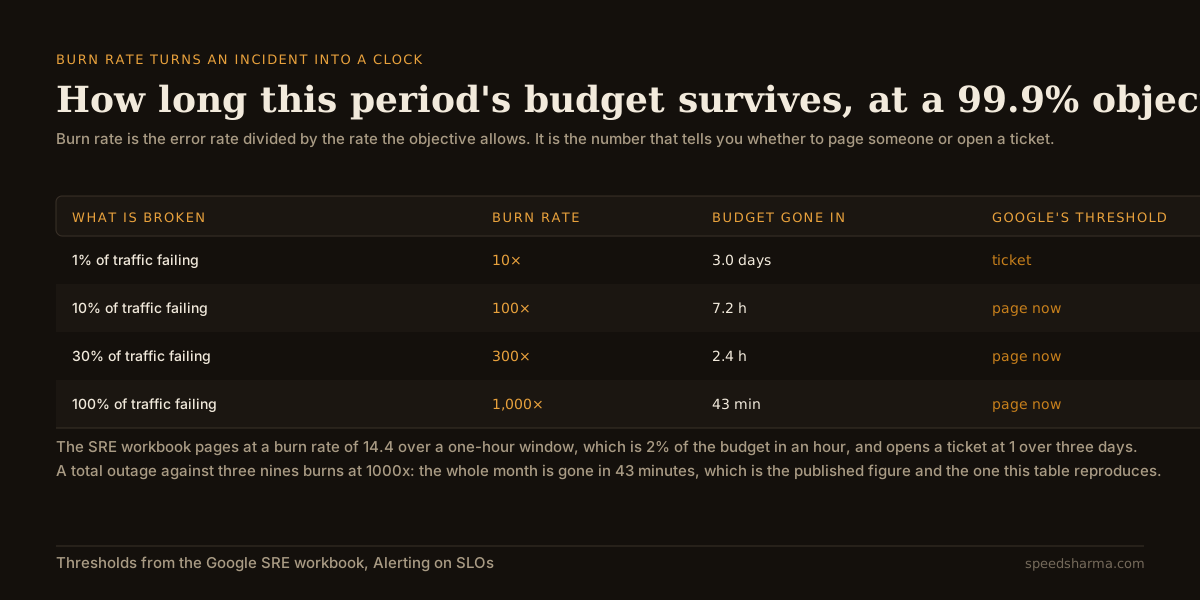
The SRE workbook's alerting guidance turns that into thresholds: page at a burn rate of 14.4 over a one-hour window, which is 2% of the budget in an hour; page at 6 over six hours, which is 5%; file a ticket at 1 over three days, which is 10%. Each is paired with a short window — five minutes, thirty minutes, six hours — that must also be breaching, so an incident that has already stopped does not page anyone.
This is the practical reason to compute a budget even if you never enforce a freeze. It converts "the error rate is elevated" into "at this rate we lose the month by lunchtime", which is a sentence people can act on at 3am. Threshold alerts on raw error rate cannot say that, which is why they get tuned until they say nothing at all.
| What fires | Alerting on an error rate | Alerting on burn rate |
|---|---|---|
| 5% errors for 5 minutes | 2% of the month's budget in an hour | |
| Same threshold at 3am and at peak | Scales with traffic automatically, because it is a ratio | |
| "Is this bad?" is a judgement call | "We lose the budget in 3 hours" is a fact | |
| Tuned by feel until it stops firing | Tuned by the objective you already agreed | |
| Silent about a slow burn that lasts a week | The three-day ticket window catches exactly that |
Four levers, and only one of them is shipping less
When the budget does not cover the plan, the argument usually collapses into "ship less" versus "lower the bar". There are four levers, and those are the two worst.
| Lever | What it changes | Typical effect |
|---|---|---|
| Blast radius | Impact per bad deploy | Canary at 5% makes each failure 6× cheaper |
| Mitigation time | Minutes per bad deploy | Auto-rollback on burn alert, 45 min to 10 |
| Change failure rate | How many deploys go bad | Tests and review; slow, real, hard to fake |
| Deploy count | How many chances to fail | Immediate, and the only one that makes delivery worse |
The first two are where the leverage is, and they are both deployment-pipeline work rather than application work. That is worth saying to a product team plainly: the fastest route to shipping more often is not more testing, it is a rollout that exposes fewer users to each mistake and a rollback that happens without a human reading a graph.
There is a fifth lever people reach for and should not, which is redefining the SLI until the failures stop counting. If your objective measures HTTP 5xx and your incidents are slow responses that eventually succeed, the budget will look healthy through an outage. The objective has to measure the thing users notice, or the whole apparatus is a way of not finding out.
quick check
Your 99.9% budget is 43 minutes a month. An incident breaks 10% of requests for two hours. How much budget is left?
Budget is spent in full-outage-equivalent time. Two hours at 10% impact is 120 × 0.1 = 12 minutes of budget, leaving about 31. This is why request-based SLIs beat "minutes of downtime": a partial failure has a price, and it is not zero and not the wall-clock duration.
What the budget cannot tell you
Not every failed request costs the same. A budget treats a failed health check and a failed checkout as one unit each. If 2% of your traffic is payments and the rest is a status page, the arithmetic here will tell you the month is fine while the part that matters is on fire. Either split the SLO per critical journey — the workbook suggests "a small number (five or fewer) of SLI types that represent the most critical functionality" — or accept that the number is a summary, not a verdict. The real cost of an hour of downtime is rarely uniform across a product.
The budget does not model correlated failures. It assumes bad deploys arrive independently at your change failure rate. Real ones cluster: a bad migration causes an incident, the fix under pressure causes another, and the rushed rollback causes a third. A month's budget can go in an afternoon in a way that no expected-value calculation predicts, which is the same shape of problem as retries amplifying a failure rather than smoothing it.
Your dependencies have already spent some of it. If your service is 99.9% and it is built on three components at 99.9% each, the achievable number is worse than any of them before you write a line of code. The way availability multiplies down a dependency chain sets a ceiling on what your own reliability work can buy, and a budget computed without it will keep coming out short for reasons nobody can find in the code.
Window choice quietly changes the answer. A calendar month resets the budget on the first, which invites shipping everything risky on the 2nd. The workbook recommends "a four-week rolling window to be a good general-purpose interval", and it is more honest: there is no reset to shelter behind, and the number always describes the experience users actually had recently.
questions people ask
How do I calculate an error budget?
Multiply the length of the period by one minus the SLO. A 99.9% objective over 30 days is 30 × 1440 × 0.001 = 43.2 minutes of full-outage-equivalent time. For a request-based SLI, the equivalent is 0.1% of all valid requests in the window.
How many deploys can I do within a 99.9% SLO?
Divide the budget available for releases by the cost of one bad deploy, then divide by your change failure rate. With 40% reserved for non-deploy failures, a 45-minute mitigation at 30% impact and a 15% change failure rate, three nines pays for roughly 12 deploys a month. Cutting blast radius or mitigation time raises that number far faster than cutting deploys does.
What is burn rate and what threshold should page someone?
Burn rate is your error rate divided by the rate the SLO allows, so 10% of requests failing against a 99.9% objective is a burn rate of 100. Google's SRE workbook pages at 14.4 over a one-hour window (2% of the budget in an hour) and at 6 over six hours, and files a ticket at 1 over three days, each paired with a shorter window that must also be breaching.
Should the error budget include planned maintenance?
If users experience it, yes. A budget that excludes the failures you scheduled is measuring your intentions rather than the service. Where maintenance is genuinely invisible to users, a request-based SLI handles it correctly on its own, because no requests fail.
What happens when the error budget runs out?
The policy is what makes it a budget: releases stop and the effort moves to reliability until the budget recovers. That only works if it is agreed in advance, in writing, by whoever owns the roadmap. Agreed after the fact, it is just a negotiation you will lose.
Is a rolling or calendar window better for an SLO?
A four-week rolling window for the day-to-day number, because it always describes the recent user experience and has no reset to game, with calendar summaries for reporting. Rolling windows are also better behaved around weekends if you use whole weeks.
The short version
An SLO is a release allowance with a fixed exchange rate. 99.9% over thirty days is 43 minutes; a bad deploy costs its mitigation time multiplied by the share of traffic it breaks; and dividing one by the other tells you how often you can ship. Most teams have never done that division, which is why the deploy freeze always arrives as a surprise.
When the answer comes out too low, the lever is almost never "deploy less". Cut the blast radius with a canary and cut the mitigation time with automatic rollback, and the same objective pays for several times the releases. Reserve part of the budget for the failures you did not cause, because you will have them.
And during an incident, burn rate is the number worth watching: it turns "errors are elevated" into "the month is gone by lunchtime", which is the only version anyone can act on quickly.